Many investors have been hoping the stock market would broaden out. In 2026, and honestly going back to 2025 and maybe even 2024, the stock market gains have been attributed to fewer than 20 stocks. The names may have changed from names like NVIDIA (NASDAQ: NVDA) and Meta Platforms (NASDAQ: META) in 2025 to Micron Technology (NASDAQ: MU) and SanDisk (NASDAQ: SNDK) in 2026.
But this may be one time when investors should have been careful about what they wished for. Due to passive money flows into retirement accounts, investing isn’t a zero-sum game. Nevertheless, in many cases, investors take gains from their winners when they take positions in different stocks.
That’s why many technology stocks got wrecked during the week of October 12. There was headline news to consider, but at a time when many stocks linked to the AI trade have rich valuations, many investors didn’t need much of a reason to sell.
Buying the dip is a sensible strategy, but not one to be executed blindly. Nevertheless, there are some opportunities presenting themselves for investors willing to follow simple technical signals.
Investing in Likely, Not Certain
Before getting into the specific stock picks, it’s important to understand that technical analysis is as much an art as it is a discipline. Whenever analysts look at chart patterns, they’re explaining what is likely to happen based on a stock’s past price action. But nobody can guarantee that patterns will repeat themselves.
That said, the fact that patterns exist at all is what makes technical analysis worth considering. Traders act on them and, in many cases, momentum does the rest. That momentum is often accelerated during earnings season. Positive financial results can confirm or reverse an existing trend.
Two of the following stocks have solid momentum setups, buying strength that has already shown itself. The third is a mean-reversion setup that still needs confirmation, which could come when the company reports earnings.
Mastercard: A Cup-and-Handle Breakout Clears $600
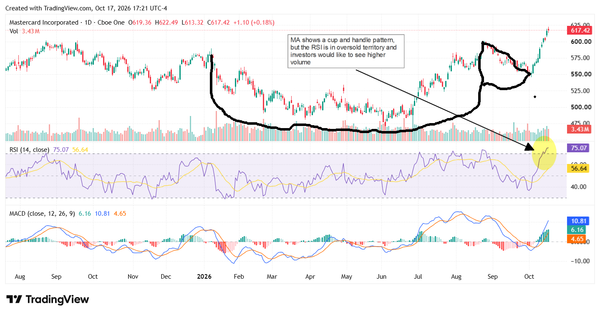
Mastercard (NYSE: MA) closed at a record $617.42 on October 16. It did that on a day the Nasdaq fell more than 2%. A stock making new highs during a tech sell-off is showing clear relative strength. Money left the AI trade, and some of it went to payment stocks.
The chart shows a classic cup-and-handle pattern. The left rim formed near $600 in August and September 2025. Shares then slid to lows near $470 in the first half of 2026. The stock rallied back to $600 by late August 2026, completing the right side of the cup.
The handle formed in September. Shares pulled back to about $548 without breaking the larger uptrend. That shakeout cleared out weak holders. In October, the stock rallied about 12% from its September 30 close. It pushed through $600, a level that had capped it three times in roughly 14 months.
Momentum backs up the price action. The MACD line (10.81) is well above its signal line (4.65). The histogram is positive and still expanding. That tells traders buying pressure is accelerating, not fading.
Levels to Watch
- Support: $600. Old resistance often becomes new support after a breakout. A retest of this level would be normal.
- Invalidation: A daily close back below $600 would make this a failed breakout.
- Measured move: The cup is about 130 points deep. Added to the $600 breakout level, that projects a target near $720 to $730.
The Risks
The 14-day RSI sits at 75.07, which is overbought. Friday’s candle also deserves attention. Shares opened at $619.36, touched $622.49, and closed lower at $617.42. That shows some sellers stepped in at the highs.
Volume has been steady rather than heavy. Traders generally prefer to see a breakout on rising volume. The bigger test comes on October 29, when Mastercard reports earnings. With shares near 29 times forward earnings, the bar is high. A pullback toward $600 before or after the report would not break the setup.
Exxon Mobil: Breaking a Six-Month Ceiling
Exxon Mobil (NYSE: XOM) rose 2.46% to a record close of $178.98 on October 16. Energy was the best-performing sector that day. West Texas Intermediate crude jumped 3.82% and topped $101 a barrel. As investors rotated out of tech, Exxon was a clear beneficiary.
The bigger story is the base Exxon just escaped. Shares ran from about $120 in January to a peak near $176 in late March. They then fell to about $136 by early July. Since then, the stock has built a series of higher lows. It bottomed near $136 in July, about $150 in August, and about $157 in late September.
While the lows kept rising, the highs stalled near $168 to $170 in August and September. Exxon broke through that range in early October. On October 12, it cleared the March peak and ended a six-month stall. Traders treat a first clean close above a multi-month high as a meaningful change in direction.
The MACD confirms the move. The MACD line crossed above its signal line in early October, close to the zero line. A crossover from neutral territory is often more reliable than one from extreme levels. The MACD line now reads 3.85 against a signal of 2.45, and the histogram is expanding.
Levels to Watch
- First support: $176 to $177, the former March high.
- Second support: $168 to $170, the August and September range highs.
- Invalidation: A break below the late-September low near $157 would end the pattern of higher lows.
The Risks
The 14-day RSI is 72.95, which is overbought. That doesn’t automatically mean a reversal. In February and March, the RSI ran above 80 before the stock peaked. But that March peak was followed by a sharp sell-off. A pause or pullback to $176 would be a healthy way to work off the overbought reading.
This setup is also tied to oil. Crude prices are elevated partly because of geopolitical tension. If that eases and oil reverses, Exxon could give back gains quickly. The company reports third-quarter results on October 30. That report will show how much of the oil rally is reaching the bottom line.

NVIDIA: Testing Support While the Sector Breaks Down
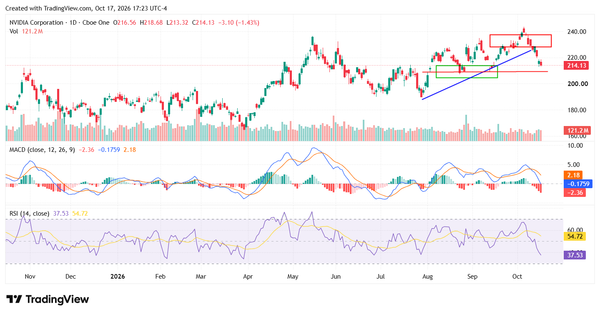
NVIDIA is the contrarian pick here. It’s also the riskiest. Chip stocks fell for an eighth straight day on October 16, the longest losing streak since 2008. NVIDIA closed at $214.13, down 1.43%. That’s still a loss, but Advanced Micro Devices fell 5.95%, and Intel fell 5.79%. When a sector leader holds up this much better than its peers, traders take notice.
The selling is about how AI customers finance the buildout. CoreWeave, whose bonds recently traded at distressed levels, dropped 12% on Friday. Investors are applying a sector-wide debt worry to the company selling the picks and shovels.
The stock is about 12% below its early-October high near $243. But the longer trend is still intact. NVIDIA bottomed near $190 in late July. Pullbacks in August and September found buyers around $208 to $210. Friday’s close puts the stock just above that zone, which traders have flagged as key support near $209.
Momentum Has Turned Negative
The short-term indicators are bearish. The MACD line (-0.18) has crossed below its signal line (2.18) and slipped under zero. The histogram reads -2.36 and is still widening. That means selling pressure is still building.
The 14-day RSI is 37.53. That’s weak but not oversold, which is typically a reading below 30. In other words, the stock has room to fall further before mean-reversion traders get a classic signal. Volume of 121.2 million shares on Friday was not a capitulation spike, either.
What Confirmation Would Look Like
- A bullish reversal candle, such as a hammer or engulfing pattern, in the $208 to $210 zone.
- The RSI turning higher without breaking below 30.
- The MACD histogram shrinking toward zero.
- A reclaim of the 200-day moving average if price dips below it.
Levels to Watch
- Support: $208 to $210, then the 200-day moving average, then the late-July low near $190.
- Resistance: $230 to $235. The stock failed there in May, September, and again on October 9.
- Invalidation: A daily close below $208 would break the pattern of higher lows since July.
This is a setup to watch, not one to front-run. Buying during an eight-day sector slide is catching a falling knife until a higher low actually forms. Earnings could supply that catalyst, but the chart needs to stop falling first.