ajax loader

Loading...


Ride-the-Wave Strategy – Best for Stock Traders

Ride-the-Wave targets multi-day price momentum following a company’s earnings announcement (EA). With this strategy:

  1. Buy a stock one day post-EA if a stock reacts positively post-earnings:
    1. Near the close of trading the EA-day for a pre-market-EA
    2. Near the close of the following day for a post-market-EA
  2. Sell-to-close after 7-10 days, or possibly earlier if a desired price target is reached

Similarly,

  1. short a stock one day post-EA if a stock reacts negatively post-earnings:
    1. near the close of trading the EA-day for a premarket-EA
    2. near the close of the following day for a post-market-EA
  2. then buy-to-close after 7-10 days, or possibly earlier if a desired price target is reached

Important: Ride-the-Wave is predicated on significant price momentum triggered by an EA. The 7-10 day scenario is the maximum trade hold-time. If you see post EA-momentum is halted or reversed by a significant opposite move, re-evaluate your presence in the trade.

This popular StockEarnings screen below will give you a list of stocks that historically exhibit significant price momentum following an EA for the next seven days:

  1. Stocks exhibiting positive post-EA price moves are buy-candidates
  2. Stocks exhibiting negative post-EA price moves are sell/short-candidates

The screen includes those stocks whose Earnings just came out in last two days.

Screen criteria:

  1. Earnings Date Start Date : Current Date + -1 Day
  2. Earnings Date End Date : Current Date + -2 Days
  3. Predicted Move (Next Day) Max : 7%
  4. Predicted Move (On 7th Day) Min : 7%

Strategy Guideline:

  1. Buy the stock if stock has reacted positively. Short the stock if stock has reacted negatively (see above).
  2. Close the position in 7-10 days, or possibly earlier based on price move.

Volatility Crush Strategy - Best for Options Traders

The Volatility Crush strategy is used with stocks that typically experience relatively low-to-moderate price moves (≤4%) following their Earnings Announcements (EA). The basic trade idea is to sell put or call options right before the EA, collecting a credit when options premium is very high due to elevated implied volatility (IV). You then close the position right after the EA by buying the option back much cheaper due to the significant drop in IV that occurs after the mystery of the EA disappears. In assessing this trade, you need to do your homework to ensure you collect sufficient premium to make the trade worthwhile.

This trade is practical due to the low-to-moderate price-move after the EA, which generally won’t significantly affect the options price, unlike an “action” stock, which experience great price moves post-EA. With these symbols, if you’re on the right side of the price move, that’s a great thing. But if you’re on the wrong side of the move, not so great. Consequently, by minimizing the effect of the post-EA price move, you have a much better chance to profit from the reduction in IV without it being ruined by a violent price move.

For this trade, open the position either (1) the night before the EA when the company announces earnings or (2) during the EA day when it announces post-market, generally capturing IV at or close to its peak.

For this trade, open the position either (1) the night before the EA when the company announces earnings or (2) during the EA day when it announces post-market, generally capturing IV at or close to its peak.

This popular stockearnings screen will give you a list of stocks which do not react more than 4% fpost-EA. It includes only those stocks whose earnings are releasing next day.

Screen criteria:

  1. Earnings Date Start Date : Current Date + 1
  2. Earnings Date End Date : Current Date + 1
  3. Predicted Move (Next Day) Max : 4%
  4. Options Type: Weekly

Strategy Guideline:

  1. Options Strategy: Sell Call and Put
  2. Options Strike Price: Current Stock Price – (% Predicated Move x 2)
  3. Expiration Date: It should generally be the closest expiry immediately after the EA.
  4. Buy Insurance: Buying back Call and Put at Strike price which 10% lower than Sell Strike Price is optional but recommended.

Watch Video for More Detail

Volatility Rush Strategy - Best for Options Traders

The Volatility Rush takes advantage of increasing options premiums into earnings announcements (EA) caused by an anticipated rise in Implied Volatility (IV). With this strategy, Buy a Call and Put at-the-money (a long straddle) 2-3 weeks before the EA when IV is lower. Sell the position either (1) the night before the EA when the company announces earnings pre-market, or (2) during the EA day when it announces post-market, generally capturing IV at or close to its peak.

This popular screen will give you a list of stocks whose Options premiums tend to rise into Earnings. It includes only those stocks whose Earnings are at least two weeks away from today.

Screen criteria:

  1. Earnings Date Start Date : Current Date + 15 Days
  2. Earnings Date End Date : Current Date + 30 Days
  3. Predicted Move (Next Day) Min : 5%
  4. Options Type: Weekly or Monthly if that lines up with the two to three-week lead-time for entering the trade

Strategy Guideline:

  1. Buy a Straddle at or close to the money two to three weeks pre-EA.
  2. Sell the position either the night before the EA when the company announces earnings pre-market, or during the EA day when it announces post-market.
  3. Expiration date should generally be the closest expiry immediately after the EA.
  4. Straddle price should not be more 60% of predicted move.

Predicted Move (Volatility)

Similar to Implied Volatility in Options. Expected volatility % based on our Proprietary Volatility Predication Model. We are expecting that stock price will likely to reach % in either direction by the end of next trading session after Earnings are released and not necessarily the closing volatility %.

Why is it important?

    This indicator helps

  1. Knowing expected volatility in stocks after Earnings helps to decide trading stocks before Earnings Announcement.
  2. Taking Advantage of volatility collapse following Earnings Results by using Advance Options strategies such as Spread and Straddles.

Since Last Earnings

Change in share price since last Earnings release.

Why is it Important?

When share has gained more than 10% since it's last Earning release, it tends to over react to minor bad news and give up some gains if not all. So, it contains more downside volatility than upside When share has dropped more than 10% since it's last Earning release, it tends to over react to minor good news and recover some drops if not all. So, it contains more upside volatility than downside.

EPS Surprise (%)

Occurs when a company's reported quarterly or annual profits are above or below analysts' expectations. Here is the formula to derive % EPS Surprice:

Actual EPS - Estimated EPS
------------------------------------- x 100
Estimated EPS

Why is it Important?

Earnings surprises can have a huge impact on a company's stock price. Several studies suggest that positive earnings surprises not only lead to an immediate hike in a stock's price, but also to a gradual increase over time. Hence, it's not surprising that some companies are known for routinely beating earning projections. A negative earnings surprise will usually result in a decline in share price.

Next Day Price Change (%)

Next Regular trading session Closing price following Earnings result.

For After Market Close Earnings, It is a next trading day closing price. For Before Market Open Earnings, It is the same trading day closing price.

Why is it Important?

Next Day price change is a reaction of Earnings result.

LEVI Stock Could Surge as Consumer Trends Create New Opportunities

Posted on Oct 19, 2026 by Joshua Enomoto

LEVI Stock Could Surge as Consumer Trends Create New Opportunities

It’s not so much that Levi Strauss (NYSE: LEVI) has been a terrible investment idea. Sure, on a year-to-date basis, LEVI stock has its head slightly below parity, which is never ideal. However, given its direct ties to the consumer economy, the apparel giant could have suffered even worse losses. Further, sentiment may be coming back strong, with the equity up over 5% in the trailing month.

Naturally, this all raises the question: is LEVI stock enjoying a one-off fluke? Or does it really have the momentum to make things interesting for debit-side options traders? I believe it’s more of the latter case.

Yes, there is an argument that LEVI stock may have burned too brightly. In the last five sessions, the ticker jumped over 10%, which is a strong performance for any security. But for Levi Strauss, lingering questions about the consumer market may make some speculators hesitant — they may prefer to wait for confirmation, as technical analysts often say.

Nevertheless, a nagging criticism awaits the confirmation-seekers: once that (bullish) confirmation arrives, Wall Street will simply rerate the new risk-reward profile of the equity in question. In other words, the confirming event will almost destroy the speculative opportunity you see right now — before the confirmation of Levi Strauss stock.

Obviously, nobody can fully guarantee whether a big move will materialize or not. However, if we had some inductive inference to believe in an undervalued opportunity, we could potentially buy LEVI stock with greater confidence (rather than sit on the sidelines waiting for confirmation).

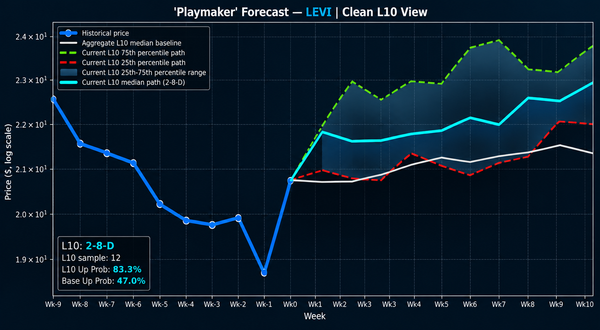
I believe such an early warning signal has already materialized. In the last 10 weekly candlesticks that Levi Strauss stock printed, only two of these sessions resulted in net positive price action. Typically, when this extremely bearish state flashes in the chart, LEVI tends to march higher, potentially placing the $22 price target for the November monthly options chain as a reasonable objective.

Why the $22 Target for LEVI Stock is Reasonable


Fundamentally, my near-term optimism for Levi Strauss stock centers on the concept of mean reversion. Basically, the theory is that publicly traded securities of stable, relevant enterprises may attempt to find an equilibrium following a sharp corrective period. However, in some cases, the target security may overshoot before settling into the baseline.

I don’t think it’s controversial at all to believe in this approach; it’s probably one of the most common technical principles. However, it’s worthwhile attempting to quantify the methodology rather than simply betting on red-stained securities.

With LEVI stock, we know that it’s not merely structured in a garden-variety bearish state. Rather, as I stated earlier, only two of the last 10 weekly candlesticks resulted in net positive action, with the overall trend across the 10-week period being negative. This particular bearish state has only materialized 12 times on a rolling basis in the past five years — thus, we know that this is a rare occurrence.

But the important point here isn’t that the market currently considers Levi Strauss stock bearish — everybody knows it. The question is, what typically happens next? Does LEVI’s bearish state continue to stay bearish? Or, as I suspect through mean-reversion theory, does it transition from its current bearish state to a future bullish one?
levi stock - STockEarnings

Thanks to historical data, we can create a program to apply an exceedance ratio at the equivalent of the $22 strike for the Nov. 20 monthly options expiration date. Under the framework of a transition from a bearish state to a bullish one, we can expect an exceedance ratio of 50%; that is, of the 12 times that the aforementioned bearish state has materialized, Levi Strauss stock happened to exceed the $22 strike on expiration six times.

Of course, there will always be variations in the market. If I had to guess a probabilistic range, it would be somewhere between 33.3% and 50%. That makes the 21/22 bull call spread expiring Nov. 20 an intriguing idea.

A Low-Cost Trade That Tempts Speculators

One aspect that stands out for the 21/22 bull spread is the low nominal cost. At $45 per spread, speculators will be betting that Levi Strauss stock rises through and triggers the $22 second-leg strike price on expiration. If it does, the maximum profit would be $55, translating to a payout of over 122%.

The other plus is the favorable asymmetry. Because the payout is over 100%, you would be profiting more than you would be betting, assuming that the trade pans out perfectly. Of course, we don’t live in a perfect world but under risk-management principles, you should aim to maximize your payout rather than to seek high probabilities in lieu of a high payout.

That said, the expected value of the $22 spread leads to sharply negative expectancy at $20.04 below zero or an expected return on capital (ROC) of -44.53%. Primarily, the reason is that the probability of LEVI stock hitting $22 on expiration is only 24.96% — a calculation derived from OptionCharts.io’s Probability Distribution screener.

Because Wall Street isn’t about to give us more payout without us accepting more risk, we would need a probability bump to make this trade worthwhile. But that was the whole exercise that we recently conducted — the market assigns a probability of 25%; we think it may be as high as 50%.

Who has the correct answer?

Leveraging the Philosophy of Probabilistic Systems

Honestly, since we’re dealing with the unknown future, nobody knows what “correct” absolutely means until the event in question eventually falsifies the underlying claim. Until then, everybody is forecasting a price from a presuppositional framework.

My presupposition is that, under certain acute circumstances, public securities will likely exhibit nonrandom trading behavior. On the flip side, the probabilities that the Street is using presuppose a random walk model. Now, I’m sure that high-level traders themselves don’t believe in the random walk exclusively. But it can’t be helped that standard options pricing mechanisms imply random markets.

So yes, if you wholeheartedly believe that LEVI stock will undergo a random walk between now and the Nov. 20 expiration date, the lower probabilities would make more sense. However, if you believe in state-to-state transitions, the data points to LEVI being a bullishly biased name.


Joshua Enomoto is a seasoned financial writer with a strong track record of in-depth stock analysis, offering clear, insightful commentary for retail investors across all levels of expertise. Renowned for his ability to blend analytical rigor with engaging wit, Joshua's work has been featured on leading investment platforms, including TipRanks, InvestorPlace, Barchart, Benzinga, and Fintel. He was also handpicked to spearhead high-impact initiatives such as InvestorPlace's "Trade of the Day" and Benzinga’s ETF coverage. As a frequent guest expert for CGTN America, Joshua discusses a wide range of economic, societal, and consumer market trends. A graduate of U.C. San Diego, Joshua brings a thoughtful and fresh perspective to complex financial narratives, helping enterprise clients connect with their audiences. He also composes music in his spare time.

Join over 1.2M+ investors/traders who receive daily and weekly notable earnings alerts with predicted move