Let’s just state facts plainly: pharmaceutical giant Novo Nordisk (NYSE: NVO) looks like a falling knife and you know exactly what folks say about such entities. Over the last five sessions, NVO stock fell more than 6%. On a year-to-date basis, the ticker has slipped roughly 23%. The signs to avoid this beaten-down name are everywhere so the prudent approach would seem to suggest heading for the sidelines.
Honestly, that’s the wise strategy to take. You don’t always have to take the crimson-stained bait. As Google Finance’s summary sheet states, “[t]he primary drivers of this negative movement include recent prominent analyst downgrades and persistent concerns regarding competitive pressures in the core obesity drug landscape.”
Analysts are even cautious about the next quarter’s prospects. Translation? Conservative investors should steer clear of Novo Nordisk stock. Yet it’s also true that, from an options trading perspective, always sitting on the sidelines at the first sign of danger will likely not net you anything.
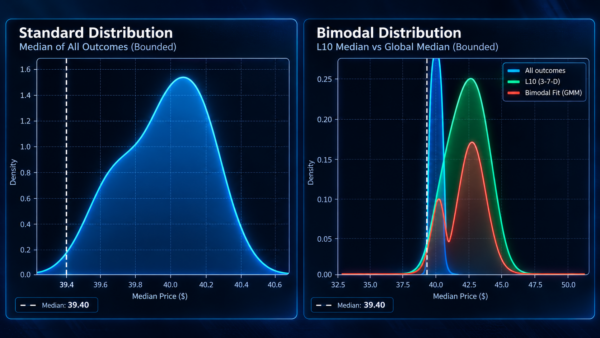
So, what’s the solution? If you have decided to participate in the risky derivatives market, then it’s in your best interest to narrow the range of candidates to the most viable. That’s never going to eliminate risk — that’s simply impossible. But with a well-reasoned methodology, you may have a decent shot at expanding your win probabilities and limiting your losses.
Stock Market Forecasting is Akin to a Religious Belief
While it may sound ridiculous at first glance, market analyses and religious beliefs hold significant structural similarities. A religion affirms a supernatural domain that cannot be objectively determined in the natural world; likewise, a forecast affirms a future value or price that has not yet actually materialized. As such, in order to get an argument moving forward, a presuppositional catalyst is required.
For example, the “doctrine” of fundamental analysis states that a stock is saved by intrinsic value. However, its valuation must be completed through the works of earnings, cash flow and balance-sheet discipline. Under technical analysis, a security’s trajectory reveals itself through recurring forms, privileged geometry and participation in the price action.
Under Markov analysis, a security’s probable trajectory is conditioned by its present state. By examining how comparable states historically transitioned, the framework identifies which future outcomes deserve probabilistic privilege without declaring any outcome inevitable.
When it comes to determining which model is “the best,” that might be a question that’s impossible to answer because every approach has its pros and cons. That doesn’t mean every presupposition is equally valid. Perhaps the closest anyone can come to a defensible argument is that certain models work better under certain conditions.
Regarding NVO stock, the reason that it intrigues me is the quantitative profile. While the crimson stain from the headline print dominates the airwaves, the more statistically interesting fact — at least from the principle of Markov chain analyses — is that in the last 10 weeks, NVO managed to only print three positive sessions, thereby leading to an overall downward slope.
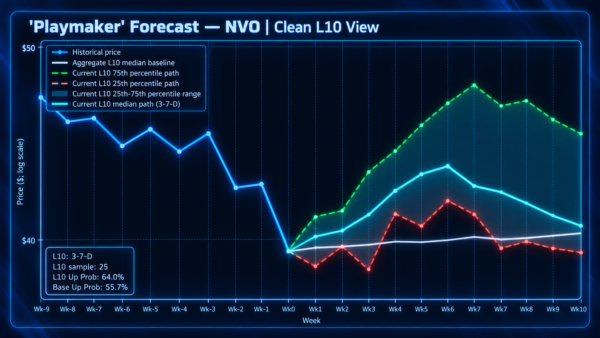
When discretized into a binary language, we might call this sequence 3-7-D: three up, seven down, downward slope. Now that we have an objectively identifiable “state,” we can look back in time to see how Novo Nordisk stock responded following this sequence. With that data, we can then create a composite picture of what we are likely to expect in the future.
NVO Stock Could be Poised for a Bounce Back
Using a dataset going back to January 2019, we know that the 3-7-D sequence has materialized 25 times on a rolling basis. That’s not a whole lot compared to the 384 rolling 10-week sequences across the entire period.
Yet of the 6.51% of the time that the aforementioned state had flashed, Novo Nordisk stock has demonstrated — as a typical response — a positive variance between the signal and the noise.
Of course, a clear warning needs to be issued right here. An average tendency to rise higher following the 3-7-D sequence does not mean a logical necessity (i.e. guarantee) that NVO stock must follow through. This Markov analysis is ultimately an inductive inference — and such inferences are never foolproof.
Nevertheless, based on historical precedent, there is a case to consider the 40.50/42 bull call spread expiring Oct. 16. Mechanically, this options strategy involves buying the spread for a net debit of $53. Should NVO stock trigger the $42 second-leg strike price on expiration, the maximum profit would be $97 — a payout of 183%.
Obviously, what makes this proposed idea so tempting is the positive asymmetry. You’re risking $53 for the chance to profit $97. Of course, Wall Street isn’t in the business of giving free lunches and the challenge here is the low chance of success.
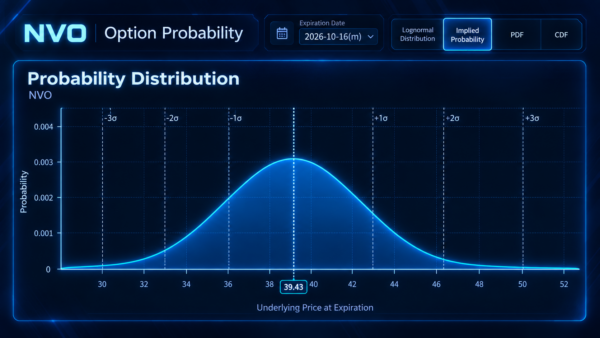
Currently, the Street’s options-pricing mechanism pegs the probability of the spread breaking even at $41.03 (on Oct. 16) at only 30.9%. What’s worse, the odds of NVO stock triggering the full-profit target of $42 sits at only 21.59%.
Running an expected value calculation will reveal a core dilemma. At this rate, running this identical trade over the theoretical long run will ruin your portfolio because the number of losses will quickly outplace the number of wins.
Still, that’s not an immediate excuse to ignore NVO stock.
What are the Presuppositions Undergirding Novo Nordisk Stock?
As stated earlier, forecasts about the future rely on initial presuppositions. For the probabilities of NVO stock above, these stats assume Black-Scholes modeling, which assumes that securities undergo a random walk between the start of the analysis to the select expiration date.
So yes, under a random, risk-neutral environment, the chances of NVO stock hitting $42 on Oct. 16 are indeed only about 22%. The question is, how reasonable is this presupposition?
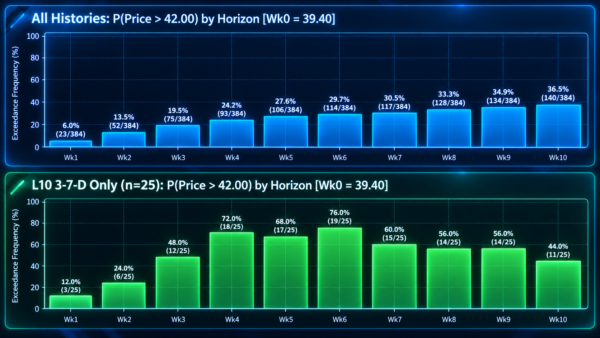
I would argue that under the current state — where Novo Nordisk stock has suffered 70% net negative sessions over the last 10 weeks — it’s less likely that the ticker will respond randomly. In my estimation, astute market observers may perceive NVO as a discount.
In fact, that is what the data (going back to January 2019) demonstrates; when 70% of NVO’s weekly candlesticks over a two-month period are net negative, a positive response is the typical near-term outcome.
Specifically, we know that in the fourth week (corresponding roughly with the Oct. 16 expiration date), NVO stock has hit the equivalent of the $42 strike price 18 times (out of 25 occurrences), implying a full-profit probability of 72%.
Granted, we absolutely need to take this calculation with a grain of salt because of the low sample size. At the same time, because this bearish state doesn’t materialize that often, speculators may feel emboldened to strike.
Ultimately, it’s up to each individual trader to decide whether they want to participate. But if you’re a risk-tolerant market participant, NVO stock does look tempting right now.

