ajax loader

Loading...


Ride-the-Wave Strategy – Best for Stock Traders

Ride-the-Wave targets multi-day price momentum following a company’s earnings announcement (EA). With this strategy:

  1. Buy a stock one day post-EA if a stock reacts positively post-earnings:
    1. Near the close of trading the EA-day for a pre-market-EA
    2. Near the close of the following day for a post-market-EA
  2. Sell-to-close after 7-10 days, or possibly earlier if a desired price target is reached

Similarly,

  1. short a stock one day post-EA if a stock reacts negatively post-earnings:
    1. near the close of trading the EA-day for a premarket-EA
    2. near the close of the following day for a post-market-EA
  2. then buy-to-close after 7-10 days, or possibly earlier if a desired price target is reached

Important: Ride-the-Wave is predicated on significant price momentum triggered by an EA. The 7-10 day scenario is the maximum trade hold-time. If you see post EA-momentum is halted or reversed by a significant opposite move, re-evaluate your presence in the trade.

This popular StockEarnings screen below will give you a list of stocks that historically exhibit significant price momentum following an EA for the next seven days:

  1. Stocks exhibiting positive post-EA price moves are buy-candidates
  2. Stocks exhibiting negative post-EA price moves are sell/short-candidates

The screen includes those stocks whose Earnings just came out in last two days.

Screen criteria:

  1. Earnings Date Start Date : Current Date + -1 Day
  2. Earnings Date End Date : Current Date + -2 Days
  3. Predicted Move (Next Day) Max : 7%
  4. Predicted Move (On 7th Day) Min : 7%

Strategy Guideline:

  1. Buy the stock if stock has reacted positively. Short the stock if stock has reacted negatively (see above).
  2. Close the position in 7-10 days, or possibly earlier based on price move.

Volatility Crush Strategy - Best for Options Traders

The Volatility Crush strategy is used with stocks that typically experience relatively low-to-moderate price moves (≤4%) following their Earnings Announcements (EA). The basic trade idea is to sell put or call options right before the EA, collecting a credit when options premium is very high due to elevated implied volatility (IV). You then close the position right after the EA by buying the option back much cheaper due to the significant drop in IV that occurs after the mystery of the EA disappears. In assessing this trade, you need to do your homework to ensure you collect sufficient premium to make the trade worthwhile.

This trade is practical due to the low-to-moderate price-move after the EA, which generally won’t significantly affect the options price, unlike an “action” stock, which experience great price moves post-EA. With these symbols, if you’re on the right side of the price move, that’s a great thing. But if you’re on the wrong side of the move, not so great. Consequently, by minimizing the effect of the post-EA price move, you have a much better chance to profit from the reduction in IV without it being ruined by a violent price move.

For this trade, open the position either (1) the night before the EA when the company announces earnings or (2) during the EA day when it announces post-market, generally capturing IV at or close to its peak.

For this trade, open the position either (1) the night before the EA when the company announces earnings or (2) during the EA day when it announces post-market, generally capturing IV at or close to its peak.

This popular stockearnings screen will give you a list of stocks which do not react more than 4% fpost-EA. It includes only those stocks whose earnings are releasing next day.

Screen criteria:

  1. Earnings Date Start Date : Current Date + 1
  2. Earnings Date End Date : Current Date + 1
  3. Predicted Move (Next Day) Max : 4%
  4. Options Type: Weekly

Strategy Guideline:

  1. Options Strategy: Sell Call and Put
  2. Options Strike Price: Current Stock Price – (% Predicated Move x 2)
  3. Expiration Date: It should generally be the closest expiry immediately after the EA.
  4. Buy Insurance: Buying back Call and Put at Strike price which 10% lower than Sell Strike Price is optional but recommended.

Watch Video for More Detail

Volatility Rush Strategy - Best for Options Traders

The Volatility Rush takes advantage of increasing options premiums into earnings announcements (EA) caused by an anticipated rise in Implied Volatility (IV). With this strategy, Buy a Call and Put at-the-money (a long straddle) 2-3 weeks before the EA when IV is lower. Sell the position either (1) the night before the EA when the company announces earnings pre-market, or (2) during the EA day when it announces post-market, generally capturing IV at or close to its peak.

This popular screen will give you a list of stocks whose Options premiums tend to rise into Earnings. It includes only those stocks whose Earnings are at least two weeks away from today.

Screen criteria:

  1. Earnings Date Start Date : Current Date + 15 Days
  2. Earnings Date End Date : Current Date + 30 Days
  3. Predicted Move (Next Day) Min : 5%
  4. Options Type: Weekly or Monthly if that lines up with the two to three-week lead-time for entering the trade

Strategy Guideline:

  1. Buy a Straddle at or close to the money two to three weeks pre-EA.
  2. Sell the position either the night before the EA when the company announces earnings pre-market, or during the EA day when it announces post-market.
  3. Expiration date should generally be the closest expiry immediately after the EA.
  4. Straddle price should not be more 60% of predicted move.

Predicted Move (Volatility)

Similar to Implied Volatility in Options. Expected volatility % based on our Proprietary Volatility Predication Model. We are expecting that stock price will likely to reach % in either direction by the end of next trading session after Earnings are released and not necessarily the closing volatility %.

Why is it important?

    This indicator helps

  1. Knowing expected volatility in stocks after Earnings helps to decide trading stocks before Earnings Announcement.
  2. Taking Advantage of volatility collapse following Earnings Results by using Advance Options strategies such as Spread and Straddles.

Since Last Earnings

Change in share price since last Earnings release.

Why is it Important?

When share has gained more than 10% since it's last Earning release, it tends to over react to minor bad news and give up some gains if not all. So, it contains more downside volatility than upside When share has dropped more than 10% since it's last Earning release, it tends to over react to minor good news and recover some drops if not all. So, it contains more upside volatility than downside.

EPS Surprise (%)

Occurs when a company's reported quarterly or annual profits are above or below analysts' expectations. Here is the formula to derive % EPS Surprice:

Actual EPS - Estimated EPS
------------------------------------- x 100
Estimated EPS

Why is it Important?

Earnings surprises can have a huge impact on a company's stock price. Several studies suggest that positive earnings surprises not only lead to an immediate hike in a stock's price, but also to a gradual increase over time. Hence, it's not surprising that some companies are known for routinely beating earning projections. A negative earnings surprise will usually result in a decline in share price.

Next Day Price Change (%)

Next Regular trading session Closing price following Earnings result.

For After Market Close Earnings, It is a next trading day closing price. For Before Market Open Earnings, It is the same trading day closing price.

Why is it Important?

Next Day price change is a reaction of Earnings result.

LongHorn’s Explosive Growth Is Powering Darden’s Portfolio

Posted on Sep 24, 2026 by Grayson Cavern

LongHorn’s Explosive Growth Is Powering Darden’s Portfolio

Darden Restaurants (NYSE:DRI) saw its same-restaurant sales increase 3.2% in the fiscal 2027 first quarter, which is roughly in the middle of the range it had in mind for all of the year, but one brand contributed more of the gain than the number of cents in the sales column indicates.

The segment margin at LongHorn Steakhouse increased by 60 basis points and sales at the company’s largest brand, Olive Garden, rose by 10.9%, but the margin decreased. With that spread, we now have a better way to read this quarter as Darden’s portfolio expands, but the growth is increasingly from a more concentrated source.

LongHorn Is Evolving Into The Growth Engine


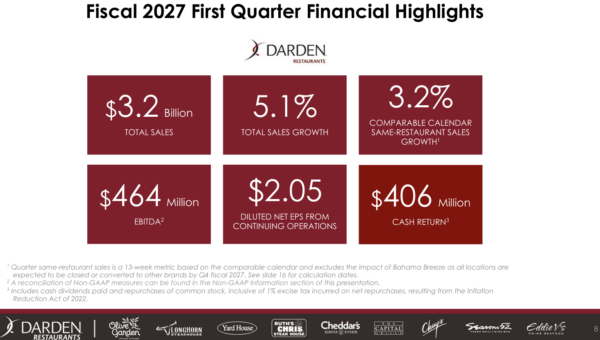
Darden’s sales rose 5.1% to $3.20 billion, and comparable-calendar same-restaurant sales grew 3.2%. Reported diluted EPS from continuing operations was $2.05, though the prior-year comparison should be adjusted as fiscal 2026 featured a $0.26-per-share gain from the sale of Olive Garden Canada. Last year’s EPS on an adjusted basis was $1.97, so this quarter’s EPS of $2.05 is up 4.1% on an adjusted basis.

That growth takes a different form when broken out into segments. Olive Garden contributed approximately $1.33 billion in sales, which declined 2.2%, and the segment margin dropped to 20.4% from 20.6%. LongHorn generated $861 million, up 10.9%, while its margin expanded from 17.4% to 18.0%. Fine Dining registered a sales increase of 3.6%, but saw margin drop from 13.5% to 13.0% and Other Business increased sales at 6.2%, decreasing margin to 15.8% from 16.1%.
longhorn - StockEarnings

LongHorn is therefore performing in two ways: it’s growing significantly faster than the segment’s biggest brand, Darden, and it’s turning that growth into more segment profit.

That’s more than another player in the steakhouse family that’s helping to fuel Darden’s portfolio. It has become the brand that’s doing the most to move the whole business.

Fighting The Margin

When considering cost structure, the consolidated numbers give you a better idea of why it’s important to watch how LongHorn performs.

Darden’s food and beverage expenses rose to 30.8% of sales, up 30 basis points from the previous year’s adjusted percentage, and restaurant labor grew to 32.2%, up 30 basis points. This combination of movements resulted in a stable restaurant-level EBITDA margin of 18.8% and an operating margin of 10.0%.

So Darden didn’t enjoy a wide margin gain all across the board. It held the line. That will be more difficult as the company goes through a fiscal year in which it expects total inflation to be around 3%. Beef is forecast to be used 29% of total commodity spending and has a low single digit inflation outlook, and seafood is projected to be used 8% of total commodity spending and has a mid single digit inflation outlook. The weighted-average commodity coverage for Darden is 65% for the September-February period.

The company has therefore carved out a helpful offset within its portfolio, as labor moved higher and margin pressure was felt at some brands, LongHorn has built up its own margin as it has grown rapidly.

The EPS Number Needs A Second Look

In the previous quarter, Darden’s gain on the sale of Olive Garden Canada was $42 million for a total of $0.26 per share before taxes. That gain, and the other prior-year adjustments, are deducted, and fiscal 2026 adjusted earnings per share drop to $1.97. The $2.05 is a 4.1% increase in adjusted EPS for this year.

That adjustment is important because Darden is also investing a lot of money into growing this business. For the quarter, the company reported operating cash flow of $275.8 million and paid $171.2 million for property, buildings and equipment. The earnings deck also showed it returned $406 million via dividends and share repurchases. The capital commitment aligns with Darden’s long-term plan of a 50%-60% dividend payout ratio, 1%-2.5% annual share repurchases and 4%-5% total cash returns to shareholders.

What matters most in the earnings story is that Darden is still investing in the restaurant business and still paying out to the shareholders as its portfolio is getting significantly more dependent on a smaller number of brands to produce incremental growth.

The Guidance Leaves LongHorn With A Job To Do

Fiscal 2027 sales are guided at $13.6 billion to $13.75 billion, with same-restaurant sales growth projected to be 2.5% to 3.5%, a total of 75 to 80 restaurant openings, about $875 million of capital spending and $11.10 to $11.35 of adjusted diluted EPS.

With 3.2% comparable sales growth, Q1’s performance is near the middle of that annual range, and Darden has not yet decided on altering that framework. But the numbers in the segment give a more precise gauge for the upcoming three quarters. As far as I’m concerned, there’s no need to suddenly make Olive Garden a double-digit grower; it’s still the biggest piece of the portfolio, and it should be able to give the company some stability. Meanwhile, LongHorn will need to continue its sales increase and margin performance, which have made it the standout this quarter.

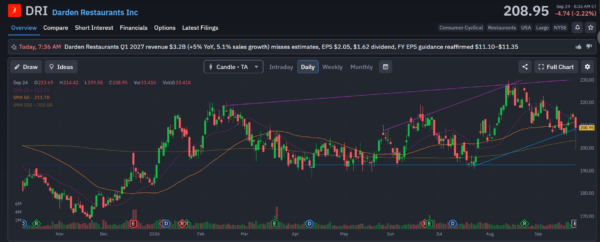
Post earnings, DRI closed around $208.95, below its 20-day moving average near $212.53 and 50-day near $211.70, while remaining above the 200-day around $203.58. The shares have pulled back from the August peak near $228 even as the business delivered a solid quarter.

LongHorn is one to watch in my opinion. Darden has a broad restaurant portfolio, but this quarter showed that it doesn’t contribute equally. Still, Darden has a clear path to continue to ramp up its earnings within its current structure if LongHorn continues to drive sales and margin gains and Olive Garden maintains its large base.
longhorn - StockEarnings

Join over 1.2M+ investors/traders who receive daily and weekly notable earnings alerts with predicted move
