ajax loader

Loading...


Ride-the-Wave Strategy – Best for Stock Traders

Ride-the-Wave targets multi-day price momentum following a company’s earnings announcement (EA). With this strategy:

  1. Buy a stock one day post-EA if a stock reacts positively post-earnings:
    1. Near the close of trading the EA-day for a pre-market-EA
    2. Near the close of the following day for a post-market-EA
  2. Sell-to-close after 7-10 days, or possibly earlier if a desired price target is reached

Similarly,

  1. short a stock one day post-EA if a stock reacts negatively post-earnings:
    1. near the close of trading the EA-day for a premarket-EA
    2. near the close of the following day for a post-market-EA
  2. then buy-to-close after 7-10 days, or possibly earlier if a desired price target is reached

Important: Ride-the-Wave is predicated on significant price momentum triggered by an EA. The 7-10 day scenario is the maximum trade hold-time. If you see post EA-momentum is halted or reversed by a significant opposite move, re-evaluate your presence in the trade.

This popular StockEarnings screen below will give you a list of stocks that historically exhibit significant price momentum following an EA for the next seven days:

  1. Stocks exhibiting positive post-EA price moves are buy-candidates
  2. Stocks exhibiting negative post-EA price moves are sell/short-candidates

The screen includes those stocks whose Earnings just came out in last two days.

Screen criteria:

  1. Earnings Date Start Date : Current Date + -1 Day
  2. Earnings Date End Date : Current Date + -2 Days
  3. Predicted Move (Next Day) Max : 7%
  4. Predicted Move (On 7th Day) Min : 7%

Strategy Guideline:

  1. Buy the stock if stock has reacted positively. Short the stock if stock has reacted negatively (see above).
  2. Close the position in 7-10 days, or possibly earlier based on price move.

Volatility Crush Strategy - Best for Options Traders

The Volatility Crush strategy is used with stocks that typically experience relatively low-to-moderate price moves (≤4%) following their Earnings Announcements (EA). The basic trade idea is to sell put or call options right before the EA, collecting a credit when options premium is very high due to elevated implied volatility (IV). You then close the position right after the EA by buying the option back much cheaper due to the significant drop in IV that occurs after the mystery of the EA disappears. In assessing this trade, you need to do your homework to ensure you collect sufficient premium to make the trade worthwhile.

This trade is practical due to the low-to-moderate price-move after the EA, which generally won’t significantly affect the options price, unlike an “action” stock, which experience great price moves post-EA. With these symbols, if you’re on the right side of the price move, that’s a great thing. But if you’re on the wrong side of the move, not so great. Consequently, by minimizing the effect of the post-EA price move, you have a much better chance to profit from the reduction in IV without it being ruined by a violent price move.

For this trade, open the position either (1) the night before the EA when the company announces earnings or (2) during the EA day when it announces post-market, generally capturing IV at or close to its peak.

For this trade, open the position either (1) the night before the EA when the company announces earnings or (2) during the EA day when it announces post-market, generally capturing IV at or close to its peak.

This popular stockearnings screen will give you a list of stocks which do not react more than 4% fpost-EA. It includes only those stocks whose earnings are releasing next day.

Screen criteria:

  1. Earnings Date Start Date : Current Date + 1
  2. Earnings Date End Date : Current Date + 1
  3. Predicted Move (Next Day) Max : 4%
  4. Options Type: Weekly

Strategy Guideline:

  1. Options Strategy: Sell Call and Put
  2. Options Strike Price: Current Stock Price – (% Predicated Move x 2)
  3. Expiration Date: It should generally be the closest expiry immediately after the EA.
  4. Buy Insurance: Buying back Call and Put at Strike price which 10% lower than Sell Strike Price is optional but recommended.

Watch Video for More Detail

Volatility Rush Strategy - Best for Options Traders

The Volatility Rush takes advantage of increasing options premiums into earnings announcements (EA) caused by an anticipated rise in Implied Volatility (IV). With this strategy, Buy a Call and Put at-the-money (a long straddle) 2-3 weeks before the EA when IV is lower. Sell the position either (1) the night before the EA when the company announces earnings pre-market, or (2) during the EA day when it announces post-market, generally capturing IV at or close to its peak.

This popular screen will give you a list of stocks whose Options premiums tend to rise into Earnings. It includes only those stocks whose Earnings are at least two weeks away from today.

Screen criteria:

  1. Earnings Date Start Date : Current Date + 15 Days
  2. Earnings Date End Date : Current Date + 30 Days
  3. Predicted Move (Next Day) Min : 5%
  4. Options Type: Weekly or Monthly if that lines up with the two to three-week lead-time for entering the trade

Strategy Guideline:

  1. Buy a Straddle at or close to the money two to three weeks pre-EA.
  2. Sell the position either the night before the EA when the company announces earnings pre-market, or during the EA day when it announces post-market.
  3. Expiration date should generally be the closest expiry immediately after the EA.
  4. Straddle price should not be more 60% of predicted move.

Predicted Move (Volatility)

Similar to Implied Volatility in Options. Expected volatility % based on our Proprietary Volatility Predication Model. We are expecting that stock price will likely to reach % in either direction by the end of next trading session after Earnings are released and not necessarily the closing volatility %.

Why is it important?

    This indicator helps

  1. Knowing expected volatility in stocks after Earnings helps to decide trading stocks before Earnings Announcement.
  2. Taking Advantage of volatility collapse following Earnings Results by using Advance Options strategies such as Spread and Straddles.

Since Last Earnings

Change in share price since last Earnings release.

Why is it Important?

When share has gained more than 10% since it's last Earning release, it tends to over react to minor bad news and give up some gains if not all. So, it contains more downside volatility than upside When share has dropped more than 10% since it's last Earning release, it tends to over react to minor good news and recover some drops if not all. So, it contains more upside volatility than downside.

EPS Surprise (%)

Occurs when a company's reported quarterly or annual profits are above or below analysts' expectations. Here is the formula to derive % EPS Surprice:

Actual EPS - Estimated EPS
------------------------------------- x 100
Estimated EPS

Why is it Important?

Earnings surprises can have a huge impact on a company's stock price. Several studies suggest that positive earnings surprises not only lead to an immediate hike in a stock's price, but also to a gradual increase over time. Hence, it's not surprising that some companies are known for routinely beating earning projections. A negative earnings surprise will usually result in a decline in share price.

Next Day Price Change (%)

Next Regular trading session Closing price following Earnings result.

For After Market Close Earnings, It is a next trading day closing price. For Before Market Open Earnings, It is the same trading day closing price.

Why is it Important?

Next Day price change is a reaction of Earnings result.

Ads, Chicken, and $8.5 Billion: Is McDonald’s Turnaround Worth Buying?

Posted on Sep 24, 2026 by Chris Markoch

Ads, Chicken, and $8.5 Billion: Is McDonald’s Turnaround Worth Buying?

“Would you like ads with that?” Like it or not, that’s what consumers are about to get when they go through a McDonald’s drive thru. At its Sept. 23 Investor Day, McDonald’s Corp. (NYSE: MCD) announced an initiative to start its own media business. That means that customers will start seeing ads while they wait for someone to take their order.  

It’s a playbook already being used by Walmart (NASDAQ: WMT) and Amazon (NASDAQ: AMZN). There’s a good reason why. Once implemented it’s a high margin business in a retail space that can find its earnings put under pressure by everything from tariffs to how inflation impacts consumers.  

Investors weren’t impressed. Shares of MCD stock were down over 4.8% in the trading session as investors saw treated the color that the company added to its Restaurant > NEXT initiative as being more sizzle than steak.  

A $1 Billion Ad Business Hiding in the Drive-Thru 


To be clear, the media network is still in its early innings. In August, 450 company-owned U.S. restaurants began showing ads for other companies on their digital drive thru order boards as part of a pilot. The program hasn’t reached the franchisees who run the rest of McDonald’s roughly 14,000 U.S. locations yet. Still, management believes it could eventually become a $1 billion business.  

The pitch to investors is simple. Chief marketing officer Morgan Flatley said U.S. commerce media is expected to top $100 billion by 2028. She described it as revenue that adds little cost and no operational complexity. And the audience is massive. McDonald’s has said it serves about 26 million Americans daily.  

Remodels Come with a Hefty Price Tag 

This is where the sticker shock set in. Through 2036, McDonald’s plans to spend up to $8.5 billion helping franchisees invest in the restaurant improvement plan. About $5 billion of that spending will be spent between now through 2030. Franchisees will face roughly $800,000 in additional costs per restaurant, with McDonald’s covering part of it through rent relief and capital support.  

Upgrades include delivery lockers, more visible coffee prep areas, bigger play areas, and better kitchen layouts. The company is also rolling out ArchIQ, an AI system built with Google to improve order accuracy and automate tasks like scheduling.  

The payoff? Management expects roughly $100,000 in annual cash flow benefits for the average U.S. restaurant. It’s also targeting an operating margin in the low-to-mid 50% range by 2030, up from 46.1% in 2025.  

Chicken, Protein, and the GLP-1 Question 

The in-store decor isn’t the only thing getting a makeover. McDonald’s is also making menu adjustments. Chicken is front and center. Hand-breaded chicken has lifted sales and quality ratings at 10,000 restaurants in Asia and a few near Chicago. Testing expands to more U.S. markets and Ireland next year.  

That puts McDonald’s in direct competition with rivals like Chick-fil-A and KFC. Grilled chicken sandwiches and wraps are also coming, along with tests of egg bites and bowls.  

That protein push speaks to the GLP-1 fear that has hung over the stock. But management says the data doesn’t back up that claim. U.S. president Skye Anderson said 84% of households with at least one GLP-1 user still visit McDonald’s. And while about 30 million Americans use the drugs, company research shows 60 million are actively seeking more protein. That’s a menu opportunity, not a data point that spikes an overreaction.  

The Consumer Is Still the Wild Card 

That doesn’t mean there are no concerns about the financial health of the consumer. U.S. same-store sales grew just 0.8% last quarter, and traffic fell. CEO Chris Kempczinski expects inflation and flat industry traffic to persist. The company also reportedly pushed its 50,000-restaurant target from 2027 to 2028. Since remodels will be phased in, the turnaround may take a couple of quarters to show up.  

Investors may need patience. The market is pricing McDonald’s as a broken brand. Management calls it an execution problem. The latter is fixable. That’s why investors don’t need to wait for proof in the numbers. Accumulating shares in stages lets you build a position before the turnaround becomes consensus.  

The MCD Chart is Starting to Look Tasty 

Let’s be clear, it’s been a rough year for McDonald’s shareholders. After spiking to a 52-week high in February, MCD is down approximately 30%.  

That’s pushing the stock down to levels it hasn’t seen for nearly four years. Strictly based on technical signals, MCD may have further to fall. The 50-week simple moving average (SMA) is declining into a slightly rising 200-week SMA. More pressure on the stock in coming days could form a death cross signal where the 50-day crosses below the 200-day. That’s almost always bearish in the short term. 
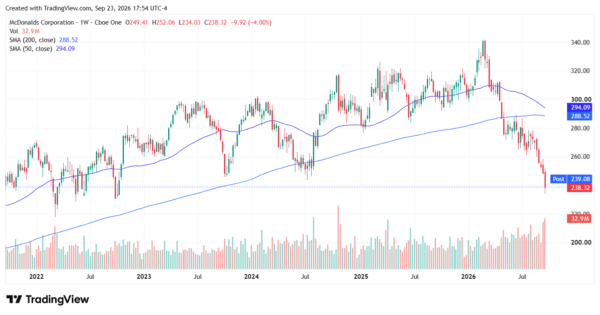
mcdonald's - StockEarnings

However, while you shouldn’t invest based on vibes, the bearish sentiment surrounding MCD feels overdone. If I have to take a bet on individuals not eating at McDonald’s or the company’s current issues being more about execution, I’ll take the latter.  

If I do, then MCD looks tasty specifically because the premium on the stock has dropped to around 19x earnings. That’s a discount to the S&P 500 and its historic average. I’ll also consider the company’s dividend. It pays me to wait, and the company increased it for the 50th consecutive year on Sept. 17, which makes it part of the exclusive club of Dividend Kings.  

A former marketing copywriter turned freelance financial writer and market analyst. I have a passion for delivering insights to investors. I write regularly about stocks for StockEarnings and MarketBeat. Posts are not advice.

Join over 1.2M+ investors/traders who receive daily and weekly notable earnings alerts with predicted move
