For all its promises and potential, Warby Parker (NYSE: WRBY) just isn’t quite getting it done. Sure, everyone is focused on the overall loss of WRBY stock, which is quite substantial. Since its first day of trading, the ticker has suffered a loss of 56.5%. But in the near-term as well, there doesn’t seem to be much room for optimism.
Yes, WRBY stock has gained tremendously from its lows. Still, this framework needs context. As an example, in the past 52 weeks, the equity has lost more than 17% of value. Further, in the trailing month, WRBY has slipped nearly 11%. That makes it one of the worst-performing mid-capitalization players within the aforementioned time period.
Fundamentally, the hits (as in the bad kind) just keep coming. What initially helped Warby Parker stock swing higher from its technical bottom was anticipation of its AI glasses partnership with Alphabet’s (NASDAQ:GOOG) Google. However, analysts have admitted that their prior forecasts were overheated relative to the reality on the ground.
It’s not that AI glasses aren’t popular — they resonate tremendously with tech-savvy consumers. However, Meta Platforms (NASDAQ:META) currently dominates this arena with a gargantuan market share. Further, analysts don’t really see the innovation contributing meaningfully to Warby Parker’s financials anytime soon. Subsequently, WRBY stock has been all over the map.
And so, while contrarianism may be a natural sentiment following a sharp downturn, that hasn’t been the best strategy overall for Warby Parker stock. It’s possible, even, that taking the contrarian’s contrarian trade — assuming that the current downturn can get worse before it gets materially better — could be the superior speculative play.
Buying the Dips to Sell the Rips is Hard to Do with WRBY Stock
Many technical analysts love to say that trading is easy — you just follow the trend. Well, it raises the obvious question, what’s the trend in Warby Parker stock? Take a look at the daily chart between early December 2025 and the current session. It’s a series of violent see-saw behaviors.
Perhaps a consensus view among technical analysts would have you buy the dip of the see-saw pattern in the hopes that you can catch the temporary wave higher for WRBY stock. And when the ticker hits its peak, you go the other way. Rinse and repeat as desired to generate risk-controlled payouts with debit spreads.
That sounds fine in principle but then it raises another question: how do you know that the dip you’re seeing right now is really the bottom in the cycle? Should Warby Parker stock rebound higher, how do you know that the peak that you perceive is, in fact, the true peak?
In order to answer these burning questions, you would have to appeal to a future price that hasn’t yet materialized. Otherwise, by logical necessity, you can only call tops and bottoms in retrospect.
This reality brings us to a critical point that often gets glossed over. All arguments about the unknown future are necessarily presuppositional. Since you don’t know what will happen in the future, you can only speak in terms of probabilities. But the calculation of those probabilities themselves rest on presuppositions.
Looking at the Stats of a Bear Put Spread
Let’s consider an ultra-aggressive strategy with “stupid” money; that is, money you can easily afford to lose. For whatever reason, you believe that WRBY stock can fall to $20 over the next few weeks. As a result, you take a look at the 22/20 bear put spread expiring Oct. 16.
Mechanically, you would be paying a net debit of $75 in a speculative bid that Warby Parker stock will trigger the downside target of $20 on expiration. If this event materializes, your maximum profit would be $125, a payout of roughly 167%.
On paper, it’s an attractive trade because of the positive asymmetry. For risking only $75, you have a chance to earn a profit of $125. However, the challenge lies in the odds of success. Just to break even at a price of $21.25 on Oct. 16, the odds sit at 27.7%. For actually triggering the second-leg strike price of $20 on expiration, the probability is only 17.81%.
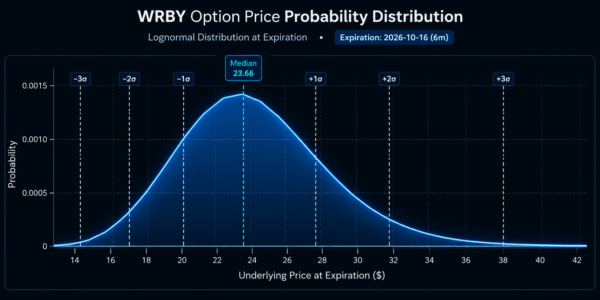
But here’s the meta question that must be asked: what’s the underlying presupposition that was used to calculate these odds? After all, these probabilities didn’t just fall from the sky as absolute declarations of truth. Remember, we don’t know what the future will hold so we have to presuppose a framework to even come up with these success ratios.
Essentially, the underlying presupposition here is Black-Scholes, which itself presupposes that WRBY stock will undergo a random walk between now and the expiration date. Imagine someone who is inebriated and has to find his credit card in a vast urban region. Naturally, the odds are going to be low.
But imagine if the person wasn’t drunk. The chances may not materially improve wholesale but they would noticeably be better on a relative basis. At the very least, the person will have access to properly functioning faculties.
Approaching Warby Parker Stock Like a Quant
What the key difference between the inebriated individual and the sober one is access to information. The reason I’m not automatically assigning full credibility to Black-Scholes is that I’m not sure if this model is the most appropriate measure of WRBY stock under the current circumstances.
Consider the quantitative perspective. We know that in the last 10 weeks, Warby Parker stock only managed to print four up weeks, leading to a negative trendline. In binary language, we might call this particular sequence 4-6-D: four up, six down, downward slope. By discretizing this specific sequence, we now have a signal or state to act as a reference point.
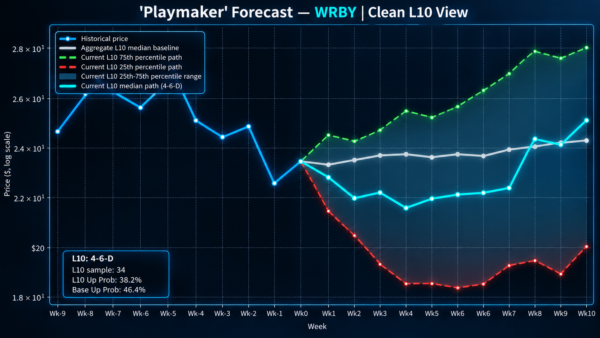
Through an algorithmic analysis of historical data, we know that this 4-6-D sequence has materialized 34 times on a rolling basis (since WRBY’s initial public offering). From this, we may calculate the exceedance ratio at $20 on week 4 (Oct. 16) — how many times has WRBY stock exceeded $20 at the target time period?
It turns out that the ticker has managed to clear the $20 level 21 times out of 34, which is a 61.8% ratio. We reverse this finding (because we’re interested in finding how many times Warby Parker stock fell below $20) and the probability comes out to 38.2%.
Is a 38.2% chance a great stat for the bearish options trader? Clearly not. But the point is that it’s a superior statistic than 17.81%.
It doesn’t mean that you should go out and speculate against WRBY stock. We’re in a bull market overall so going against the grain is probabilistically dangerous. However, if you want to take a stupid bet, the WRBY bear put is a smarter trade than Wall Street is giving it credit for.

