ajax loader

Loading...


Ride-the-Wave Strategy – Best for Stock Traders

Ride-the-Wave targets multi-day price momentum following a company’s earnings announcement (EA). With this strategy:

  1. Buy a stock one day post-EA if a stock reacts positively post-earnings:
    1. Near the close of trading the EA-day for a pre-market-EA
    2. Near the close of the following day for a post-market-EA
  2. Sell-to-close after 7-10 days, or possibly earlier if a desired price target is reached

Similarly,

  1. short a stock one day post-EA if a stock reacts negatively post-earnings:
    1. near the close of trading the EA-day for a premarket-EA
    2. near the close of the following day for a post-market-EA
  2. then buy-to-close after 7-10 days, or possibly earlier if a desired price target is reached

Important: Ride-the-Wave is predicated on significant price momentum triggered by an EA. The 7-10 day scenario is the maximum trade hold-time. If you see post EA-momentum is halted or reversed by a significant opposite move, re-evaluate your presence in the trade.

This popular StockEarnings screen below will give you a list of stocks that historically exhibit significant price momentum following an EA for the next seven days:

  1. Stocks exhibiting positive post-EA price moves are buy-candidates
  2. Stocks exhibiting negative post-EA price moves are sell/short-candidates

The screen includes those stocks whose Earnings just came out in last two days.

Screen criteria:

  1. Earnings Date Start Date : Current Date + -1 Day
  2. Earnings Date End Date : Current Date + -2 Days
  3. Predicted Move (Next Day) Max : 7%
  4. Predicted Move (On 7th Day) Min : 7%

Strategy Guideline:

  1. Buy the stock if stock has reacted positively. Short the stock if stock has reacted negatively (see above).
  2. Close the position in 7-10 days, or possibly earlier based on price move.

Volatility Crush Strategy - Best for Options Traders

The Volatility Crush strategy is used with stocks that typically experience relatively low-to-moderate price moves (≤4%) following their Earnings Announcements (EA). The basic trade idea is to sell put or call options right before the EA, collecting a credit when options premium is very high due to elevated implied volatility (IV). You then close the position right after the EA by buying the option back much cheaper due to the significant drop in IV that occurs after the mystery of the EA disappears. In assessing this trade, you need to do your homework to ensure you collect sufficient premium to make the trade worthwhile.

This trade is practical due to the low-to-moderate price-move after the EA, which generally won’t significantly affect the options price, unlike an “action” stock, which experience great price moves post-EA. With these symbols, if you’re on the right side of the price move, that’s a great thing. But if you’re on the wrong side of the move, not so great. Consequently, by minimizing the effect of the post-EA price move, you have a much better chance to profit from the reduction in IV without it being ruined by a violent price move.

For this trade, open the position either (1) the night before the EA when the company announces earnings or (2) during the EA day when it announces post-market, generally capturing IV at or close to its peak.

For this trade, open the position either (1) the night before the EA when the company announces earnings or (2) during the EA day when it announces post-market, generally capturing IV at or close to its peak.

This popular stockearnings screen will give you a list of stocks which do not react more than 4% fpost-EA. It includes only those stocks whose earnings are releasing next day.

Screen criteria:

  1. Earnings Date Start Date : Current Date + 1
  2. Earnings Date End Date : Current Date + 1
  3. Predicted Move (Next Day) Max : 4%
  4. Options Type: Weekly

Strategy Guideline:

  1. Options Strategy: Sell Call and Put
  2. Options Strike Price: Current Stock Price – (% Predicated Move x 2)
  3. Expiration Date: It should generally be the closest expiry immediately after the EA.
  4. Buy Insurance: Buying back Call and Put at Strike price which 10% lower than Sell Strike Price is optional but recommended.

Watch Video for More Detail

Volatility Rush Strategy - Best for Options Traders

The Volatility Rush takes advantage of increasing options premiums into earnings announcements (EA) caused by an anticipated rise in Implied Volatility (IV). With this strategy, Buy a Call and Put at-the-money (a long straddle) 2-3 weeks before the EA when IV is lower. Sell the position either (1) the night before the EA when the company announces earnings pre-market, or (2) during the EA day when it announces post-market, generally capturing IV at or close to its peak.

This popular screen will give you a list of stocks whose Options premiums tend to rise into Earnings. It includes only those stocks whose Earnings are at least two weeks away from today.

Screen criteria:

  1. Earnings Date Start Date : Current Date + 15 Days
  2. Earnings Date End Date : Current Date + 30 Days
  3. Predicted Move (Next Day) Min : 5%
  4. Options Type: Weekly or Monthly if that lines up with the two to three-week lead-time for entering the trade

Strategy Guideline:

  1. Buy a Straddle at or close to the money two to three weeks pre-EA.
  2. Sell the position either the night before the EA when the company announces earnings pre-market, or during the EA day when it announces post-market.
  3. Expiration date should generally be the closest expiry immediately after the EA.
  4. Straddle price should not be more 60% of predicted move.

Predicted Move (Volatility)

Similar to Implied Volatility in Options. Expected volatility % based on our Proprietary Volatility Predication Model. We are expecting that stock price will likely to reach % in either direction by the end of next trading session after Earnings are released and not necessarily the closing volatility %.

Why is it important?

    This indicator helps

  1. Knowing expected volatility in stocks after Earnings helps to decide trading stocks before Earnings Announcement.
  2. Taking Advantage of volatility collapse following Earnings Results by using Advance Options strategies such as Spread and Straddles.

Since Last Earnings

Change in share price since last Earnings release.

Why is it Important?

When share has gained more than 10% since it's last Earning release, it tends to over react to minor bad news and give up some gains if not all. So, it contains more downside volatility than upside When share has dropped more than 10% since it's last Earning release, it tends to over react to minor good news and recover some drops if not all. So, it contains more upside volatility than downside.

EPS Surprise (%)

Occurs when a company's reported quarterly or annual profits are above or below analysts' expectations. Here is the formula to derive % EPS Surprice:

Actual EPS - Estimated EPS
------------------------------------- x 100
Estimated EPS

Why is it Important?

Earnings surprises can have a huge impact on a company's stock price. Several studies suggest that positive earnings surprises not only lead to an immediate hike in a stock's price, but also to a gradual increase over time. Hence, it's not surprising that some companies are known for routinely beating earning projections. A negative earnings surprise will usually result in a decline in share price.

Next Day Price Change (%)

Next Regular trading session Closing price following Earnings result.

For After Market Close Earnings, It is a next trading day closing price. For Before Market Open Earnings, It is the same trading day closing price.

Why is it Important?

Next Day price change is a reaction of Earnings result.

Oracle’s Jupiter Warning Puts a Premium on Neocloud Stocks

Posted on Sep 25, 2026 by Chris Markoch

Oracle’s Jupiter Warning Puts a Premium on Neocloud Stocks

Neocloud stocks are getting attention for an unusual reason. The trigger centers around the debate over data centers. It’s one thing to suggest that some projects will never get off the ground. It’s another when hyperscalers seek protection for a possible delay at a data center under construction.

On Sept. 24, Bloomberg reported that Oracle sent a force majeure notice to Blue Owl Capital, which owns Stack Infrastructure, a developer behind Project Jupiter. Oracle (NYSE: ORCL) wants to be able to defer payments if the data center doesn’t open in 2028 as planned.

The investor thesis writes itself. If new capacity is going to be delayed, existing capacity becomes more valuable. That puts three neocloud companies: Nebius Group (NASDAQ: NBIS), CoreWeave (NASDAQ: CRWV), and IREN Ltd. (NASDAQ: IREN) back in focus.

The reaction was uneven, though. Nebius rose 6% to $240.86, CoreWeave slipped 0.64% to $86.34, and IREN fell 4% to $45.21. That split matters. The market is paying for proof, not promises.

The perception is that any delay helps any neocloud company with live capacity. The fundamentals depend on pricing, balance sheets, and how much capacity is actually online.

Oracle’s Jupiter Delay Raises Neocloud Stakes


Oracle says Project Jupiter is still on schedule. Stack Infrastructure says the notice doesn’t change the financial commitments to the project. But the backdrop is messy.

An Energy Transfer (NYSE: ET) natural gas pipeline meant to supply the site was pushed back almost six months, to Feb. 1, 2027, after the New Mexico State Land Office repeatedly denied permits for its route.

Financing is another pressure point. The project runs through a special purpose vehicle, with Blue Owl (NYSE: OWL) equity and an $18 billion loan from roughly 20 banks. If Oracle defers payments, the developer’s collections could slip while construction and financing costs keep coming.

Jupiter is not a small project. It’s designed for up to 2.45 gigawatts and is a flagship of the Stargate initiative with OpenAI and SoftBank. S&P also cut Oracle’s credit rating to BBB- in July, one notch above junk.

That’s why this notice matters beyond New Mexico. The debate has shifted from how much demand exists to how fast capacity arrives. Oracle’s remaining performance obligations reached $664 billion last quarter. But backlog only counts once the power is on.

Nebius Shows Neocloud Pricing Power

Nebius led the group higher. Pricing is a big part of the story. The company plans 17% to 21% price increases across its H100 through B300 GPU capacity on Oct. 1, its second hike in three months. BNP Paribas Exane also upgraded Nebius to Outperform, lifting its target to $399 from $260.

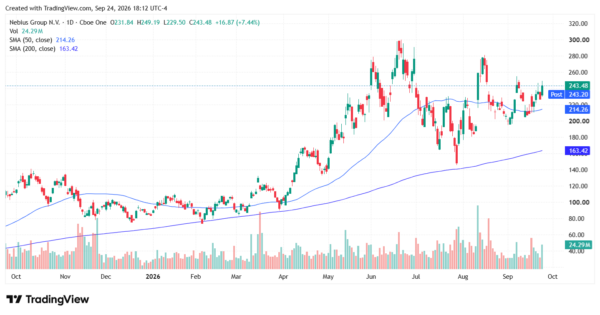
Technically, Nebius has the cleanest setup of the three. Earlier this month, it traded above its 20-, 50-, 100- and 200-day moving averages, with the 200-day near $156. Its RSI sat near 57, in neutral territory. That leaves room to run.

The level to watch is the June peak. Nebius hit an all-time high of $299.86 on June 22. A break above that confirms the uptrend. A stall there raises double-top risk.
neocloud - StockEarnings

CoreWeave Faces a Stubborn Neocloud Chart

CoreWeave has plenty of reasons to benefit from a capacity squeeze. JPMorgan upgraded it to Overweight Thursday with a $125 target, citing stronger demand and higher compute prices. Still, the stock barely budged.

The company is already charging more. CoreWeave raised prices about 25% in July and is signing some shorter-term contracts at higher rates. Its short-dated Q3 contracts came in around $40 million per megawatt.

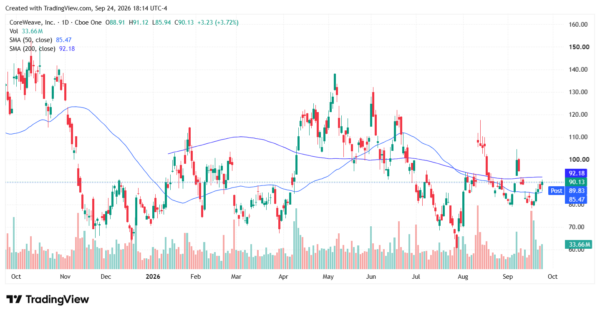
The chart hasn’t caught up. Last week, CoreWeave traded below its 20-, 50-, 100- and 200-day moving averages. Its July death cross remains intact. Key resistance sits near $94.50. Bulls need a close above that level to change the narrative.
neocloud - StockEarnings

IREN Has Power but Needs More Revenue

IREN was Thursday’s laggard. Rothschild initiated coverage at Neutral with a $40 target, flagging the capital gap between IREN’s 5-gigawatt power base and its actual AI revenue.

That gap is the whole debate. IREN’s operating AI cloud capacity was about 40 megawatts at the end of June, against roughly 5 gigawatts in grid connection agreements. Its Horizon 1 facility has been delivered to and accepted by Microsoft, which is a step in the right direction.

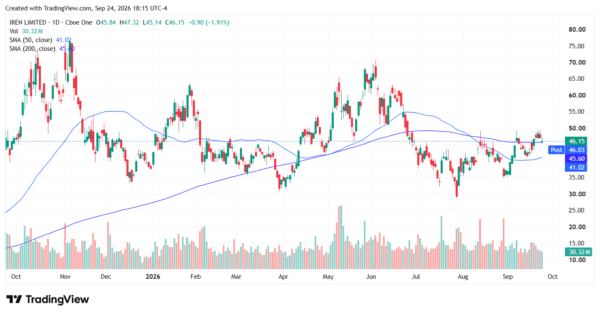
On the chart, IREN is range-bound. Support sits near $40.20, with resistance near $50.30. The stock remains well below its $76.87 all-time high from November 2025. A push through $50 would show investors believe the buildout is on track.
neocloud - StockEarnings

Neocloud Valuations Face a Bigger Test

Here’s the risk. If Jupiter’s troubles reflect financing strain, neoclouds are more exposed, not less.

Rothschild Redburn put Sell ratings on CoreWeave and Nebius this week. Its thesis doesn’t need AI demand to collapse. It only needs GPU rental economics to normalize as supply grows and big customers build their own.

Debt is the pressure point. CoreWeave pays about 8.3% on its debt, versus 2.3% for Nebius and 1.7% for IREN. But IREN’s debt is largely convertibles, which dilute shareholders. CoreWeave also just upsized a $4.2 billion convertible note offering.

Short sellers are circling. Short interest recently stood near 23% for Nebius, 12.8% for CoreWeave, and 24% for IREN. That can fuel squeezes. It can also speed up declines.

Macro doesn’t help. The 30-year Treasury yield just hit its highest level since 2004. Capital-hungry growth stocks rarely thrive when borrowing costs climb.

The group has unwound before. In July, Nebius dropped 13% in a single session amid broad de-risking across the neocloud trade. If the story shifts from “delays create scarcity” to “delays expose leverage,” it could happen again. Yahoo Finance

What Oracle Means for Neocloud Stocks

Oracle’s notice is a reminder that capacity on paper isn’t capacity online. That’s a real edge for neoclouds with GPUs already running.

But investors should separate the headline from the fundamentals. Nebius has the pricing and the chart. CoreWeave has the backlog but needs to clear resistance. IREN has the power but must prove the revenue. The scarcity premium is real. Whether it lasts depends on balance sheets, not press releases.


A former marketing copywriter turned freelance financial writer and market analyst. I have a passion for delivering insights to investors. I write regularly about stocks for StockEarnings and MarketBeat. Posts are not advice.

Join over 1.2M+ investors/traders who receive daily and weekly notable earnings alerts with predicted move