ajax loader

Loading...


Ride-the-Wave Strategy – Best for Stock Traders

Ride-the-Wave targets multi-day price momentum following a company’s earnings announcement (EA). With this strategy:

  1. Buy a stock one day post-EA if a stock reacts positively post-earnings:
    1. Near the close of trading the EA-day for a pre-market-EA
    2. Near the close of the following day for a post-market-EA
  2. Sell-to-close after 7-10 days, or possibly earlier if a desired price target is reached

Similarly,

  1. short a stock one day post-EA if a stock reacts negatively post-earnings:
    1. near the close of trading the EA-day for a premarket-EA
    2. near the close of the following day for a post-market-EA
  2. then buy-to-close after 7-10 days, or possibly earlier if a desired price target is reached

Important: Ride-the-Wave is predicated on significant price momentum triggered by an EA. The 7-10 day scenario is the maximum trade hold-time. If you see post EA-momentum is halted or reversed by a significant opposite move, re-evaluate your presence in the trade.

This popular StockEarnings screen below will give you a list of stocks that historically exhibit significant price momentum following an EA for the next seven days:

  1. Stocks exhibiting positive post-EA price moves are buy-candidates
  2. Stocks exhibiting negative post-EA price moves are sell/short-candidates

The screen includes those stocks whose Earnings just came out in last two days.

Screen criteria:

  1. Earnings Date Start Date : Current Date + -1 Day
  2. Earnings Date End Date : Current Date + -2 Days
  3. Predicted Move (Next Day) Max : 7%
  4. Predicted Move (On 7th Day) Min : 7%

Strategy Guideline:

  1. Buy the stock if stock has reacted positively. Short the stock if stock has reacted negatively (see above).
  2. Close the position in 7-10 days, or possibly earlier based on price move.

Volatility Crush Strategy - Best for Options Traders

The Volatility Crush strategy is used with stocks that typically experience relatively low-to-moderate price moves (≤4%) following their Earnings Announcements (EA). The basic trade idea is to sell put or call options right before the EA, collecting a credit when options premium is very high due to elevated implied volatility (IV). You then close the position right after the EA by buying the option back much cheaper due to the significant drop in IV that occurs after the mystery of the EA disappears. In assessing this trade, you need to do your homework to ensure you collect sufficient premium to make the trade worthwhile.

This trade is practical due to the low-to-moderate price-move after the EA, which generally won’t significantly affect the options price, unlike an “action” stock, which experience great price moves post-EA. With these symbols, if you’re on the right side of the price move, that’s a great thing. But if you’re on the wrong side of the move, not so great. Consequently, by minimizing the effect of the post-EA price move, you have a much better chance to profit from the reduction in IV without it being ruined by a violent price move.

For this trade, open the position either (1) the night before the EA when the company announces earnings or (2) during the EA day when it announces post-market, generally capturing IV at or close to its peak.

For this trade, open the position either (1) the night before the EA when the company announces earnings or (2) during the EA day when it announces post-market, generally capturing IV at or close to its peak.

This popular stockearnings screen will give you a list of stocks which do not react more than 4% fpost-EA. It includes only those stocks whose earnings are releasing next day.

Screen criteria:

  1. Earnings Date Start Date : Current Date + 1
  2. Earnings Date End Date : Current Date + 1
  3. Predicted Move (Next Day) Max : 4%
  4. Options Type: Weekly

Strategy Guideline:

  1. Options Strategy: Sell Call and Put
  2. Options Strike Price: Current Stock Price – (% Predicated Move x 2)
  3. Expiration Date: It should generally be the closest expiry immediately after the EA.
  4. Buy Insurance: Buying back Call and Put at Strike price which 10% lower than Sell Strike Price is optional but recommended.

Watch Video for More Detail

Volatility Rush Strategy - Best for Options Traders

The Volatility Rush takes advantage of increasing options premiums into earnings announcements (EA) caused by an anticipated rise in Implied Volatility (IV). With this strategy, Buy a Call and Put at-the-money (a long straddle) 2-3 weeks before the EA when IV is lower. Sell the position either (1) the night before the EA when the company announces earnings pre-market, or (2) during the EA day when it announces post-market, generally capturing IV at or close to its peak.

This popular screen will give you a list of stocks whose Options premiums tend to rise into Earnings. It includes only those stocks whose Earnings are at least two weeks away from today.

Screen criteria:

  1. Earnings Date Start Date : Current Date + 15 Days
  2. Earnings Date End Date : Current Date + 30 Days
  3. Predicted Move (Next Day) Min : 5%
  4. Options Type: Weekly or Monthly if that lines up with the two to three-week lead-time for entering the trade

Strategy Guideline:

  1. Buy a Straddle at or close to the money two to three weeks pre-EA.
  2. Sell the position either the night before the EA when the company announces earnings pre-market, or during the EA day when it announces post-market.
  3. Expiration date should generally be the closest expiry immediately after the EA.
  4. Straddle price should not be more 60% of predicted move.

Predicted Move (Volatility)

Similar to Implied Volatility in Options. Expected volatility % based on our Proprietary Volatility Predication Model. We are expecting that stock price will likely to reach % in either direction by the end of next trading session after Earnings are released and not necessarily the closing volatility %.

Why is it important?

    This indicator helps

  1. Knowing expected volatility in stocks after Earnings helps to decide trading stocks before Earnings Announcement.
  2. Taking Advantage of volatility collapse following Earnings Results by using Advance Options strategies such as Spread and Straddles.

Since Last Earnings

Change in share price since last Earnings release.

Why is it Important?

When share has gained more than 10% since it's last Earning release, it tends to over react to minor bad news and give up some gains if not all. So, it contains more downside volatility than upside When share has dropped more than 10% since it's last Earning release, it tends to over react to minor good news and recover some drops if not all. So, it contains more upside volatility than downside.

EPS Surprise (%)

Occurs when a company's reported quarterly or annual profits are above or below analysts' expectations. Here is the formula to derive % EPS Surprice:

Actual EPS - Estimated EPS
------------------------------------- x 100
Estimated EPS

Why is it Important?

Earnings surprises can have a huge impact on a company's stock price. Several studies suggest that positive earnings surprises not only lead to an immediate hike in a stock's price, but also to a gradual increase over time. Hence, it's not surprising that some companies are known for routinely beating earning projections. A negative earnings surprise will usually result in a decline in share price.

Next Day Price Change (%)

Next Regular trading session Closing price following Earnings result.

For After Market Close Earnings, It is a next trading day closing price. For Before Market Open Earnings, It is the same trading day closing price.

Why is it Important?

Next Day price change is a reaction of Earnings result.

September Earnings Recap: 3 Stocks With Results Worth Buying

Posted on Oct 05, 2026 by Grayson Cavern

September Earnings Recap: 3 Stocks With Results Worth Buying

Some earnings reports answer questions investors have been asking for months. Others create entirely new ones. September gave us both, with Adobe (NASDAQ: ADBE), Casey’s General Stores (NASDAQ: CASY), and Oracle (NYSE: ORCL) delivering results that deserve a closer look beyond their headline revenue and EPS figures.

I had already examined the questions surrounding these three businesses before or around their earnings releases: whether Adobe could turn AI adoption into actual revenue, whether Casey’s slowing same-store sales concealed stronger underlying profitability, and whether Oracle could convert its enormous AI backlog into financial performance. Their latest results provide new evidence for each argument, although the conclusions aren’t equally straightforward. 

Adobe Stock Shows AI Growth Is Turning Into Revenue


In my previous coverage of Adobe, I questioned whether the company’s growing AI audience could translate into meaningful revenue. Its Q3 FY2026 report gave us a much clearer answer, with AI-first ARR surpassing $650 million, up more than 150% year over year.

The company also delivered $6.76 billion in revenue, representing 13% growth, while non-GAAP EPS climbed 15% to $6.13. Both figures exceeded expectations, and management raised its full-year revenue and earnings outlook.

Firefly’s ending ARR grew 40% sequentially, providing another indication that customers are beginning to pay for Adobe’s AI capabilities. More importantly, Adobe is taking these tools into its enterprise ecosystem, where businesses already spend heavily on content creation, marketing and customer experience.

That gives the company a sizeable installed base from which to expand AI monetization, although its total ARR growth slowed to 11.2% from 12.5% in Q2. Yes, the AI business is growing rapidly, but the company still needs to prove it can accelerate its broader revenue base.

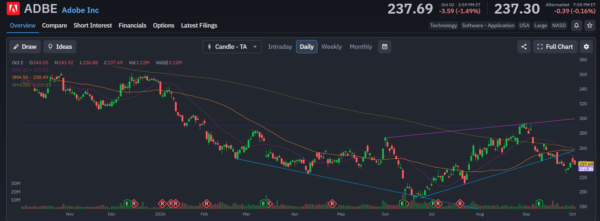
ADBE closed October 2 at $237.69, trading below its 20-day SMA at $247.05, 50-day at $258.49, and 200-day at $259.87. The chart has deteriorated considerably from its September peak near $295, with the stock now testing the lower end of its recent trading range.

I want to see buyers reclaim $247 first, followed by the 258–260 cluster where the 50-day and 200-day averages converge. That would provide the first meaningful evidence of a trend reversal. Until then, the earnings strength makes ADBE attractive to me, but the chart still needs repairing.
Casey’s Stock Delivers Strong Earnings Despite Slower Sales Growth

When Casey’s reported its first-quarter results, the market punished the stock for slowing same-store sales despite a 27.7% increase in diluted EPS. I once made a case that the headline sales figures weren’t telling the entire story, particularly as fuel margins expanded and the company continued adding stores.

The September report reinforced the importance of looking beyond that comparable-store growth. Revenue reached $5.68 billion, up 24.3%, while diluted EPS increased to $7.37 from $5.77 a year earlier. Net income rose to $273.7 million, and EBITDA advanced 17.1% to $485.1 million.

The margin story deserves some attention as well, as fuel gross profit climbed 19.6% to $446.9 million even as same-store fuel gallons declined 0.3%. Inside gross profit also increased 6.3%, supported by prepared food and dispensed beverages. Casey’s is extracting more profit from its existing operations while expanding its footprint. Management expects at least 120 new stores through acquisitions and construction in fiscal 2027, giving the company another avenue for growth.

There are risks. Operating expenses increased 8%, and fuel margins can fluctuate. Still, the earnings performance gives me confidence that the company has more going for it than its comparable-store sales figures suggest.

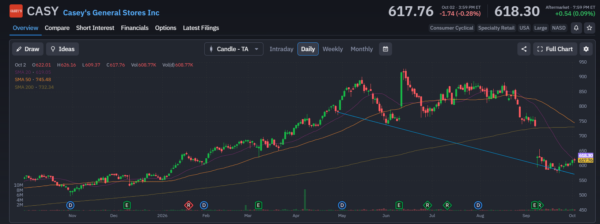
The stock closed October 2 at $617.76, hovering around its 20-day SMA at $619.05 after recovering from the $590 area. That recovery is encouraging, although the stock remains well below its 50-day average at $745.48 and 200-day at $732.34.

The $600 region is the immediate support zone I want buyers to defend. A sustained move above $620 would improve the short-term setup, while reclaiming 732–745 would mark a much stronger recovery. I am buying CASY here, with the understanding that the chart has yet to confirm a broader trend reversal.
Oracle Stock Surges on Cloud Growth and a $664 Billion Backlog

Ahead of Oracle’s September earnings report, I argued that its $638 billion backlog was only half the story. The bigger question was whether the company could convert those commitments into revenue without allowing infrastructure spending to overwhelm its financial position.

Q1 FY2027 delivered a significant step forward on the demand side. Revenue increased 30% to $14.93 billion, while cloud revenue surged 62% to $11.67 billion. Cloud infrastructure revenue was particularly impressive, climbing 121% to $4.21 billion.

Remaining performance obligations also increased to $664 billion from $638 billion in June. That is another $26 billion in contracted future business, reinforcing the scale of demand Oracle is attracting.

However, capital expenditure reached $28.5 billion, leaving free cash flow negative $5.4 billion. Oracle is now converting customer demand into substantial revenue growth, but the cost of building the capacity to service those commitments remains enormous.

I want to see how quickly that spending translates into stronger cash economics. For now, the demand trajectory is strong enough to keep me bullish.

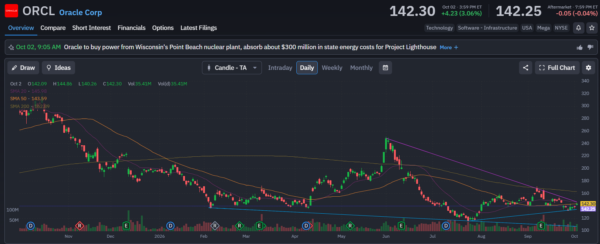
ORCL closed October 2 at $142.30, below its 20-day SMA at $145.98, 50-day at $143.59 and 200-day at $162.89. The chart is compressing around the 140–145 region, with a descending resistance trendline limiting upside.

A break above $146 would be the first sign of improving momentum, while $150 represents another area worth watching. Reclaiming the 200-day average near $163 would provide a much stronger technical confirmation.

I am buying ORCL because its cloud growth and expanding backlog give the company a substantial revenue opportunity, even as investors demand evidence that the infrastructure spending will eventually pay off.
Join over 1.2M+ investors/traders who receive daily and weekly notable earnings alerts with predicted move
