ajax loader

Loading...


Ride-the-Wave Strategy – Best for Stock Traders

Ride-the-Wave targets multi-day price momentum following a company’s earnings announcement (EA). With this strategy:

  1. Buy a stock one day post-EA if a stock reacts positively post-earnings:
    1. Near the close of trading the EA-day for a pre-market-EA
    2. Near the close of the following day for a post-market-EA
  2. Sell-to-close after 7-10 days, or possibly earlier if a desired price target is reached

Similarly,

  1. short a stock one day post-EA if a stock reacts negatively post-earnings:
    1. near the close of trading the EA-day for a premarket-EA
    2. near the close of the following day for a post-market-EA
  2. then buy-to-close after 7-10 days, or possibly earlier if a desired price target is reached

Important: Ride-the-Wave is predicated on significant price momentum triggered by an EA. The 7-10 day scenario is the maximum trade hold-time. If you see post EA-momentum is halted or reversed by a significant opposite move, re-evaluate your presence in the trade.

This popular StockEarnings screen below will give you a list of stocks that historically exhibit significant price momentum following an EA for the next seven days:

  1. Stocks exhibiting positive post-EA price moves are buy-candidates
  2. Stocks exhibiting negative post-EA price moves are sell/short-candidates

The screen includes those stocks whose Earnings just came out in last two days.

Screen criteria:

  1. Earnings Date Start Date : Current Date + -1 Day
  2. Earnings Date End Date : Current Date + -2 Days
  3. Predicted Move (Next Day) Max : 7%
  4. Predicted Move (On 7th Day) Min : 7%

Strategy Guideline:

  1. Buy the stock if stock has reacted positively. Short the stock if stock has reacted negatively (see above).
  2. Close the position in 7-10 days, or possibly earlier based on price move.

Volatility Crush Strategy - Best for Options Traders

The Volatility Crush strategy is used with stocks that typically experience relatively low-to-moderate price moves (≤4%) following their Earnings Announcements (EA). The basic trade idea is to sell put or call options right before the EA, collecting a credit when options premium is very high due to elevated implied volatility (IV). You then close the position right after the EA by buying the option back much cheaper due to the significant drop in IV that occurs after the mystery of the EA disappears. In assessing this trade, you need to do your homework to ensure you collect sufficient premium to make the trade worthwhile.

This trade is practical due to the low-to-moderate price-move after the EA, which generally won’t significantly affect the options price, unlike an “action” stock, which experience great price moves post-EA. With these symbols, if you’re on the right side of the price move, that’s a great thing. But if you’re on the wrong side of the move, not so great. Consequently, by minimizing the effect of the post-EA price move, you have a much better chance to profit from the reduction in IV without it being ruined by a violent price move.

For this trade, open the position either (1) the night before the EA when the company announces earnings or (2) during the EA day when it announces post-market, generally capturing IV at or close to its peak.

For this trade, open the position either (1) the night before the EA when the company announces earnings or (2) during the EA day when it announces post-market, generally capturing IV at or close to its peak.

This popular stockearnings screen will give you a list of stocks which do not react more than 4% fpost-EA. It includes only those stocks whose earnings are releasing next day.

Screen criteria:

  1. Earnings Date Start Date : Current Date + 1
  2. Earnings Date End Date : Current Date + 1
  3. Predicted Move (Next Day) Max : 4%
  4. Options Type: Weekly

Strategy Guideline:

  1. Options Strategy: Sell Call and Put
  2. Options Strike Price: Current Stock Price – (% Predicated Move x 2)
  3. Expiration Date: It should generally be the closest expiry immediately after the EA.
  4. Buy Insurance: Buying back Call and Put at Strike price which 10% lower than Sell Strike Price is optional but recommended.

Watch Video for More Detail

Volatility Rush Strategy - Best for Options Traders

The Volatility Rush takes advantage of increasing options premiums into earnings announcements (EA) caused by an anticipated rise in Implied Volatility (IV). With this strategy, Buy a Call and Put at-the-money (a long straddle) 2-3 weeks before the EA when IV is lower. Sell the position either (1) the night before the EA when the company announces earnings pre-market, or (2) during the EA day when it announces post-market, generally capturing IV at or close to its peak.

This popular screen will give you a list of stocks whose Options premiums tend to rise into Earnings. It includes only those stocks whose Earnings are at least two weeks away from today.

Screen criteria:

  1. Earnings Date Start Date : Current Date + 15 Days
  2. Earnings Date End Date : Current Date + 30 Days
  3. Predicted Move (Next Day) Min : 5%
  4. Options Type: Weekly or Monthly if that lines up with the two to three-week lead-time for entering the trade

Strategy Guideline:

  1. Buy a Straddle at or close to the money two to three weeks pre-EA.
  2. Sell the position either the night before the EA when the company announces earnings pre-market, or during the EA day when it announces post-market.
  3. Expiration date should generally be the closest expiry immediately after the EA.
  4. Straddle price should not be more 60% of predicted move.

Predicted Move (Volatility)

Similar to Implied Volatility in Options. Expected volatility % based on our Proprietary Volatility Predication Model. We are expecting that stock price will likely to reach % in either direction by the end of next trading session after Earnings are released and not necessarily the closing volatility %.

Why is it important?

    This indicator helps

  1. Knowing expected volatility in stocks after Earnings helps to decide trading stocks before Earnings Announcement.
  2. Taking Advantage of volatility collapse following Earnings Results by using Advance Options strategies such as Spread and Straddles.

Since Last Earnings

Change in share price since last Earnings release.

Why is it Important?

When share has gained more than 10% since it's last Earning release, it tends to over react to minor bad news and give up some gains if not all. So, it contains more downside volatility than upside When share has dropped more than 10% since it's last Earning release, it tends to over react to minor good news and recover some drops if not all. So, it contains more upside volatility than downside.

EPS Surprise (%)

Occurs when a company's reported quarterly or annual profits are above or below analysts' expectations. Here is the formula to derive % EPS Surprice:

Actual EPS - Estimated EPS
------------------------------------- x 100
Estimated EPS

Why is it Important?

Earnings surprises can have a huge impact on a company's stock price. Several studies suggest that positive earnings surprises not only lead to an immediate hike in a stock's price, but also to a gradual increase over time. Hence, it's not surprising that some companies are known for routinely beating earning projections. A negative earnings surprise will usually result in a decline in share price.

Next Day Price Change (%)

Next Regular trading session Closing price following Earnings result.

For After Market Close Earnings, It is a next trading day closing price. For Before Market Open Earnings, It is the same trading day closing price.

Why is it Important?

Next Day price change is a reaction of Earnings result.

Rocket Lab Stock Gets a Boost from Launch Deal and a Buy Rating  

Posted on Oct 02, 2026 by Ian Cooper

Rocket Lab Stock Gets a Boost from Launch Deal and a Buy Rating  

Rocket Lab (NASDAQ: RKLB) is giving investors another reason to be bullish on the stock. The company just secured its largest commercial Electron launch agreement, adding years of scheduled missions and strengthening a relationship with an important customer.

For one, the company announced a multiyear agreement with Tokyo-based Synspective for 20 additional Electron launches. The missions are scheduled annually from 2028 through 2031, bringing Synspective’s total contracted Electron launches to 47, the highest number booked by any customer. Financial terms were not disclosed.

Citi Sees Major Upside for RKLB Stock


Two, Citi analyst John Godyn initiated coverage with a Buy rating and a $105 price target, describing the space company as a potential core holding for investors bullish on space. Citi highlighted the company’s commercial launch capabilities and broader space technology operations.

As noted by Seeking Alpha, the analyst described Rocket Lab as a “core holding for space bulls,” adding that, “As one of the only companies on the planet delivering regular commercial access to orbit,” Rocket Lab is positioned to benefit from growth across the space industry.

Synspective Deal Expands Rocket Lab’s Launch Backlog

Synspective plans to use the launches to expand its StriX radar satellite network. Its goal is to build a constellation capable of imaging any location on Earth within hours, including at night and through clouds. Earth observation data can support disaster response, environmental monitoring, and national security, among other uses. Rocket Lab has previously highlighted those applications when discussing its work with Synspective.

Think about the challenge from the satellite operator’s perspective. Designing and building spacecraft is only part of the job. Those satellites also need to reach the right orbit on a schedule that supports the business. A dedicated launch service can help address that need. Customers are paying for access to orbit, but scheduling and mission requirements also matter.

In addition, Rocket Lab said the agreement pushed its total launch backlog beyond 100 missions. These missions extend through 2031, supporting a longer business relationship rather than a single burst of activity. 

Revenue Growth Is Accelerating

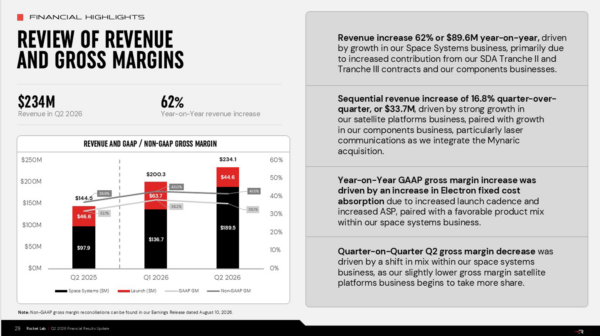
In its most recent earnings report, the company’s EPS of negative eight cents was in line with expectations. Revenue of $234.06 million, up 62% year over year, beat by $3.12 million. 
rocket lab - StockEarnings

Rocket Lab founder and CEO, Sir Peter Beck, says: “Q2 was another fantastic quarter for Rocket Lab, highlighted by record results and massive momentum that has continued well after the close. We achieved a record $234 million in Q2 revenue – up 62% year-over-year and $34 million higher than last quarter’s record – driven by surging demand across all areas of our business. Q2 2026 saw our backlog grow to $2.36 billion – another record – which, combined with new deals in the period since, equates to more than $1 billion in new contracts across launch and space systems already entered into in Q3.”

RKLB Stock Tests Key Technical Levels

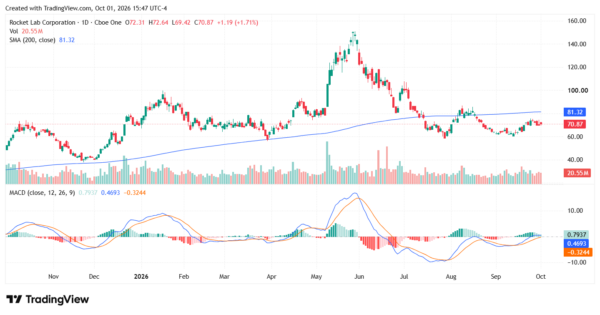
RKLB stock has rebounded sharply from its September low, but the chart shows that RKLB is still working through a significant technical test. Shares closed at $69.68 on Sept. 30, after reaching $75.46 on Sept. 24 and pulling back toward the $70 area. The stock’s recent price action has therefore created a near-term range between roughly $69 and $75.

The $75 area is the first important resistance level to watch. A decisive move above that zone would take RKLB back above its recent September highs. On the downside, the $69-$70 area has become important support, with the stock repeatedly trading around that level in recent sessions.

The longer-term chart remains more complicated. Current technical data put the 50-day simple moving average around $69.67, while the 100-day and 200-day averages are substantially higher at roughly $87.79 and $81.28, respectively. That suggests the recent recovery has improved the shorter-term setup, but RKLB still has longer-term technical hurdles to overcome.

Momentum indicators are also mixed. RSI is near the neutral 50 level, while MACD readings are slightly negative, pointing to a market that has not yet established a clear directional trend.
rocket lab - StockEarnings

Why Rocket Lab’s Backlog Matters for Investors

For investors, the biggest takeaway is that Rocket Lab is turning demand for satellite launches into long-term customer commitments. Synspective’s decision to book another 20 missions suggests confidence in the relationship and gives Rocket Lab more visibility into future business. It also strengthens the argument that dedicated small-satellite launches have an important place in the growing space industry.

Of course, winning contracts is only part of the equation. Rocket Lab still needs to deliver those missions reliably, control costs, and translate its expanding backlog into stronger financial results. With financial terms undisclosed, investors cannot yet judge how profitable this latest agreement will be.

Still, the deal gives shareholders a concrete reason for optimism. Combined with Citi’s bullish outlook, it puts RKLB in the spotlight—and gives investors clear milestones to watch as the company works to turn a busy launch calendar into lasting growth.


Over the last 26 years, he’s taught thousands of investors how to trade news flow and herd mentality using a unique blend of technical and fundamental analysis. Cooper was among the few analysts to spot the financial crisis of 2008, the top of subprime and Alt-A, the death of Lehman Brothers, Bear Stearns, and New Century Financial, and even the Dow’s collapse to 6,500, as well as its recovery. He even called for gold to rally well above $1.500 when it traded under $600. At the moment, Cooper makes use of technical, fundamental and news analysis, to help individual investors grow their wealth. He’s a firm believer that hard work and thorough research will lead to investment success.

Join over 1.2M+ investors/traders who receive daily and weekly notable earnings alerts with predicted move