ajax loader

Loading...


Ride-the-Wave Strategy – Best for Stock Traders

Ride-the-Wave targets multi-day price momentum following a company’s earnings announcement (EA). With this strategy:

  1. Buy a stock one day post-EA if a stock reacts positively post-earnings:
    1. Near the close of trading the EA-day for a pre-market-EA
    2. Near the close of the following day for a post-market-EA
  2. Sell-to-close after 7-10 days, or possibly earlier if a desired price target is reached

Similarly,

  1. short a stock one day post-EA if a stock reacts negatively post-earnings:
    1. near the close of trading the EA-day for a premarket-EA
    2. near the close of the following day for a post-market-EA
  2. then buy-to-close after 7-10 days, or possibly earlier if a desired price target is reached

Important: Ride-the-Wave is predicated on significant price momentum triggered by an EA. The 7-10 day scenario is the maximum trade hold-time. If you see post EA-momentum is halted or reversed by a significant opposite move, re-evaluate your presence in the trade.

This popular StockEarnings screen below will give you a list of stocks that historically exhibit significant price momentum following an EA for the next seven days:

  1. Stocks exhibiting positive post-EA price moves are buy-candidates
  2. Stocks exhibiting negative post-EA price moves are sell/short-candidates

The screen includes those stocks whose Earnings just came out in last two days.

Screen criteria:

  1. Earnings Date Start Date : Current Date + -1 Day
  2. Earnings Date End Date : Current Date + -2 Days
  3. Predicted Move (Next Day) Max : 7%
  4. Predicted Move (On 7th Day) Min : 7%

Strategy Guideline:

  1. Buy the stock if stock has reacted positively. Short the stock if stock has reacted negatively (see above).
  2. Close the position in 7-10 days, or possibly earlier based on price move.

Volatility Crush Strategy - Best for Options Traders

The Volatility Crush strategy is used with stocks that typically experience relatively low-to-moderate price moves (≤4%) following their Earnings Announcements (EA). The basic trade idea is to sell put or call options right before the EA, collecting a credit when options premium is very high due to elevated implied volatility (IV). You then close the position right after the EA by buying the option back much cheaper due to the significant drop in IV that occurs after the mystery of the EA disappears. In assessing this trade, you need to do your homework to ensure you collect sufficient premium to make the trade worthwhile.

This trade is practical due to the low-to-moderate price-move after the EA, which generally won’t significantly affect the options price, unlike an “action” stock, which experience great price moves post-EA. With these symbols, if you’re on the right side of the price move, that’s a great thing. But if you’re on the wrong side of the move, not so great. Consequently, by minimizing the effect of the post-EA price move, you have a much better chance to profit from the reduction in IV without it being ruined by a violent price move.

For this trade, open the position either (1) the night before the EA when the company announces earnings or (2) during the EA day when it announces post-market, generally capturing IV at or close to its peak.

For this trade, open the position either (1) the night before the EA when the company announces earnings or (2) during the EA day when it announces post-market, generally capturing IV at or close to its peak.

This popular stockearnings screen will give you a list of stocks which do not react more than 4% fpost-EA. It includes only those stocks whose earnings are releasing next day.

Screen criteria:

  1. Earnings Date Start Date : Current Date + 1
  2. Earnings Date End Date : Current Date + 1
  3. Predicted Move (Next Day) Max : 4%
  4. Options Type: Weekly

Strategy Guideline:

  1. Options Strategy: Sell Call and Put
  2. Options Strike Price: Current Stock Price – (% Predicated Move x 2)
  3. Expiration Date: It should generally be the closest expiry immediately after the EA.
  4. Buy Insurance: Buying back Call and Put at Strike price which 10% lower than Sell Strike Price is optional but recommended.

Watch Video for More Detail

Volatility Rush Strategy - Best for Options Traders

The Volatility Rush takes advantage of increasing options premiums into earnings announcements (EA) caused by an anticipated rise in Implied Volatility (IV). With this strategy, Buy a Call and Put at-the-money (a long straddle) 2-3 weeks before the EA when IV is lower. Sell the position either (1) the night before the EA when the company announces earnings pre-market, or (2) during the EA day when it announces post-market, generally capturing IV at or close to its peak.

This popular screen will give you a list of stocks whose Options premiums tend to rise into Earnings. It includes only those stocks whose Earnings are at least two weeks away from today.

Screen criteria:

  1. Earnings Date Start Date : Current Date + 15 Days
  2. Earnings Date End Date : Current Date + 30 Days
  3. Predicted Move (Next Day) Min : 5%
  4. Options Type: Weekly or Monthly if that lines up with the two to three-week lead-time for entering the trade

Strategy Guideline:

  1. Buy a Straddle at or close to the money two to three weeks pre-EA.
  2. Sell the position either the night before the EA when the company announces earnings pre-market, or during the EA day when it announces post-market.
  3. Expiration date should generally be the closest expiry immediately after the EA.
  4. Straddle price should not be more 60% of predicted move.

Predicted Move (Volatility)

Similar to Implied Volatility in Options. Expected volatility % based on our Proprietary Volatility Predication Model. We are expecting that stock price will likely to reach % in either direction by the end of next trading session after Earnings are released and not necessarily the closing volatility %.

Why is it important?

    This indicator helps

  1. Knowing expected volatility in stocks after Earnings helps to decide trading stocks before Earnings Announcement.
  2. Taking Advantage of volatility collapse following Earnings Results by using Advance Options strategies such as Spread and Straddles.

Since Last Earnings

Change in share price since last Earnings release.

Why is it Important?

When share has gained more than 10% since it's last Earning release, it tends to over react to minor bad news and give up some gains if not all. So, it contains more downside volatility than upside When share has dropped more than 10% since it's last Earning release, it tends to over react to minor good news and recover some drops if not all. So, it contains more upside volatility than downside.

EPS Surprise (%)

Occurs when a company's reported quarterly or annual profits are above or below analysts' expectations. Here is the formula to derive % EPS Surprice:

Actual EPS - Estimated EPS
------------------------------------- x 100
Estimated EPS

Why is it Important?

Earnings surprises can have a huge impact on a company's stock price. Several studies suggest that positive earnings surprises not only lead to an immediate hike in a stock's price, but also to a gradual increase over time. Hence, it's not surprising that some companies are known for routinely beating earning projections. A negative earnings surprise will usually result in a decline in share price.

Next Day Price Change (%)

Next Regular trading session Closing price following Earnings result.

For After Market Close Earnings, It is a next trading day closing price. For Before Market Open Earnings, It is the same trading day closing price.

Why is it Important?

Next Day price change is a reaction of Earnings result.

Nike’s Reset Is Getting More Expensive Before the Turnaround Arrives

Posted on Oct 02, 2026 by Grayson Cavern

Nike’s Reset Is Getting More Expensive Before the Turnaround Arrives

When we last looked at Nike Inc. (NYSE: NKE) in this piece, the risk was that investors could get ahead of a turnaround that might take two or three years to show up in the financials. At roughly $41, the stock already had room to fall toward $28 if sales stayed weak, margins failed to recover, and the market ran out of patience.

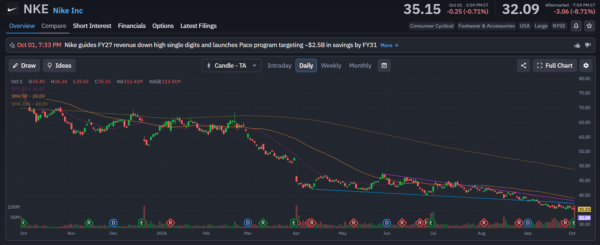
Nike has now handed us a tougher version of that setup in Q1 FY2027 as revenue fell 5% on a currency-neutral basis, and management expects FY27 revenue to decline by high single digits. All of which led to the stock closing at $35.15 before dropping to $32.09 after hours.

Now the company did deliver a 60-basis-point gross-margin improvement to 42.8%, with diluted EPS of $0.48, down 2%. But that margin progress came alongside lower sales, and the new outlook points to a longer reset than the market may have been willing to price in. 

Nike’s Strongest Business Still Can’t Carry The Reset


Nike’s performance portfolio grew at a high-single-digit rate in Q1, led by double-digit growth in Running, Global Football, Tennis and Golf. Running continued to gain share, while Global Football benefited from World Cup demand. Management also said performance would have grown at a low-double-digit rate excluding the Greater China reset.

That isn’t too bad, as Nike still has products consumers are buying, and its performance business is producing growth. But the problem is that management said performance is not yet large enough to offset the pressure in Sportswear, Jordan Brand and Greater China. Those businesses, including Men’s, Women’s and Kids, represented a high-single-digit drag on consolidated Nike in Q1.

Sportswear, which accounted for just under half of quarterly revenue, declined by low double digits. Nike deliberately cut Dunk revenue by nearly 50%, creating an estimated $200 million headwind, while older, higher-volume footwear also sold below expectations and weighed on future wholesale orders. The company is trying to clear excess inventory and bring more product differentiation back to the category.

Jordan is getting a similar reset. It represented 13% of global business, with revenue down mid-teens, as Nike plans to reduce the volume and frequency of selected retro launches. China is under even heavier pressure: revenue fell 26%, with wholesale down 31% and Direct down 18% on a currency-neutral basis. 

This is a deliberate pullback in some areas, but the numbers show that Nike is also dealing with product weakness and soft demand. The Dunk reduction explains part of Sportswear’s decline; it does not explain the entire category. And China’s digital cleanup is expected to take multiple seasons, with management warning that revenue and profitability will be affected in the near term.

The Margin Recovery Has A Long Runway

Nike’s Q1 gross margin improved mainly because warehousing and logistics costs came down. Supply-chain cost management and favorable currency movements helped, while increased discounts and channel mix worked against the improvement. Meanwhile, selling and administrative expense fell 3% to $3.9 billion, but demand-creation spending rose 5% to $1.3 billion as Nike invested more in sports marketing. 

That is a useful combination for now: Nike is trimming overhead while still spending to build demand. But the margin gain is modest beside the sales problem, and the company is preparing investors for a heavier earnings reset.

Its new Pace program is expected to generate approximately $2.5 billion in cumulative savings through FY31, against about $1 billion in pre-tax implementation charges, plus roughly $300 million of severance costs recognized in FY26. Another $300 million of Pace-related charges is expected in FY27. Most of the savings are expected in FY29 and FY30, with the program fully realized into FY31.

That timeline deserves scrutiny because Nike is now asking investors to absorb a high-single-digit revenue decline in FY27 while waiting several years for most of the savings to arrive. The company expects adjusted FY27 EPS of $1.15 to $1.35, excluding approximately $0.15 of Pace restructuring expenses. 

The Stock Has Already Started Repricing The Wait

The balance sheet gives Nike room to execute. Cash and short-term investments stood at $8.4 billion, inventory was $7.8 billion, down 3%, and the company returned approximately $610 million through dividends during the quarter.

But the stock is trading below its key moving averages: $36.49 for the 20-day, $39.09 for the 50-day, and $48.89 for the 200-day. At $32.09 after hours, NKE is also pressing toward the lower end of its recent trading range. 

The market is being asked to value a turnaround whose strongest growth engine is still too small, whose major lifestyle franchises need a reset, and whose cost savings arrive mostly years from now. 

But as an answer to my last article on Nike – yes, the business has pockets of genuine momentum, but management’s own FY2027 outlook says the reset will keep weighing on sales and EBIT. I want to see the stock stabilize first, then see evidence that the product cleanup is translating into better orders and full-price demand. Put another way, I’m staying on the sidelines until the sales trend gives the chart a reason to turn. 
nike - StockEarnings

Join over 1.2M+ investors/traders who receive daily and weekly notable earnings alerts with predicted move
