ajax loader

Loading...


Ride-the-Wave Strategy – Best for Stock Traders

Ride-the-Wave targets multi-day price momentum following a company’s earnings announcement (EA). With this strategy:

  1. Buy a stock one day post-EA if a stock reacts positively post-earnings:
    1. Near the close of trading the EA-day for a pre-market-EA
    2. Near the close of the following day for a post-market-EA
  2. Sell-to-close after 7-10 days, or possibly earlier if a desired price target is reached

Similarly,

  1. short a stock one day post-EA if a stock reacts negatively post-earnings:
    1. near the close of trading the EA-day for a premarket-EA
    2. near the close of the following day for a post-market-EA
  2. then buy-to-close after 7-10 days, or possibly earlier if a desired price target is reached

Important: Ride-the-Wave is predicated on significant price momentum triggered by an EA. The 7-10 day scenario is the maximum trade hold-time. If you see post EA-momentum is halted or reversed by a significant opposite move, re-evaluate your presence in the trade.

This popular StockEarnings screen below will give you a list of stocks that historically exhibit significant price momentum following an EA for the next seven days:

  1. Stocks exhibiting positive post-EA price moves are buy-candidates
  2. Stocks exhibiting negative post-EA price moves are sell/short-candidates

The screen includes those stocks whose Earnings just came out in last two days.

Screen criteria:

  1. Earnings Date Start Date : Current Date + -1 Day
  2. Earnings Date End Date : Current Date + -2 Days
  3. Predicted Move (Next Day) Max : 7%
  4. Predicted Move (On 7th Day) Min : 7%

Strategy Guideline:

  1. Buy the stock if stock has reacted positively. Short the stock if stock has reacted negatively (see above).
  2. Close the position in 7-10 days, or possibly earlier based on price move.

Volatility Crush Strategy - Best for Options Traders

The Volatility Crush strategy is used with stocks that typically experience relatively low-to-moderate price moves (≤4%) following their Earnings Announcements (EA). The basic trade idea is to sell put or call options right before the EA, collecting a credit when options premium is very high due to elevated implied volatility (IV). You then close the position right after the EA by buying the option back much cheaper due to the significant drop in IV that occurs after the mystery of the EA disappears. In assessing this trade, you need to do your homework to ensure you collect sufficient premium to make the trade worthwhile.

This trade is practical due to the low-to-moderate price-move after the EA, which generally won’t significantly affect the options price, unlike an “action” stock, which experience great price moves post-EA. With these symbols, if you’re on the right side of the price move, that’s a great thing. But if you’re on the wrong side of the move, not so great. Consequently, by minimizing the effect of the post-EA price move, you have a much better chance to profit from the reduction in IV without it being ruined by a violent price move.

For this trade, open the position either (1) the night before the EA when the company announces earnings or (2) during the EA day when it announces post-market, generally capturing IV at or close to its peak.

For this trade, open the position either (1) the night before the EA when the company announces earnings or (2) during the EA day when it announces post-market, generally capturing IV at or close to its peak.

This popular stockearnings screen will give you a list of stocks which do not react more than 4% fpost-EA. It includes only those stocks whose earnings are releasing next day.

Screen criteria:

  1. Earnings Date Start Date : Current Date + 1
  2. Earnings Date End Date : Current Date + 1
  3. Predicted Move (Next Day) Max : 4%
  4. Options Type: Weekly

Strategy Guideline:

  1. Options Strategy: Sell Call and Put
  2. Options Strike Price: Current Stock Price – (% Predicated Move x 2)
  3. Expiration Date: It should generally be the closest expiry immediately after the EA.
  4. Buy Insurance: Buying back Call and Put at Strike price which 10% lower than Sell Strike Price is optional but recommended.

Watch Video for More Detail

Volatility Rush Strategy - Best for Options Traders

The Volatility Rush takes advantage of increasing options premiums into earnings announcements (EA) caused by an anticipated rise in Implied Volatility (IV). With this strategy, Buy a Call and Put at-the-money (a long straddle) 2-3 weeks before the EA when IV is lower. Sell the position either (1) the night before the EA when the company announces earnings pre-market, or (2) during the EA day when it announces post-market, generally capturing IV at or close to its peak.

This popular screen will give you a list of stocks whose Options premiums tend to rise into Earnings. It includes only those stocks whose Earnings are at least two weeks away from today.

Screen criteria:

  1. Earnings Date Start Date : Current Date + 15 Days
  2. Earnings Date End Date : Current Date + 30 Days
  3. Predicted Move (Next Day) Min : 5%
  4. Options Type: Weekly or Monthly if that lines up with the two to three-week lead-time for entering the trade

Strategy Guideline:

  1. Buy a Straddle at or close to the money two to three weeks pre-EA.
  2. Sell the position either the night before the EA when the company announces earnings pre-market, or during the EA day when it announces post-market.
  3. Expiration date should generally be the closest expiry immediately after the EA.
  4. Straddle price should not be more 60% of predicted move.

Predicted Move (Volatility)

Similar to Implied Volatility in Options. Expected volatility % based on our Proprietary Volatility Predication Model. We are expecting that stock price will likely to reach % in either direction by the end of next trading session after Earnings are released and not necessarily the closing volatility %.

Why is it important?

    This indicator helps

  1. Knowing expected volatility in stocks after Earnings helps to decide trading stocks before Earnings Announcement.
  2. Taking Advantage of volatility collapse following Earnings Results by using Advance Options strategies such as Spread and Straddles.

Since Last Earnings

Change in share price since last Earnings release.

Why is it Important?

When share has gained more than 10% since it's last Earning release, it tends to over react to minor bad news and give up some gains if not all. So, it contains more downside volatility than upside When share has dropped more than 10% since it's last Earning release, it tends to over react to minor good news and recover some drops if not all. So, it contains more upside volatility than downside.

EPS Surprise (%)

Occurs when a company's reported quarterly or annual profits are above or below analysts' expectations. Here is the formula to derive % EPS Surprice:

Actual EPS - Estimated EPS
------------------------------------- x 100
Estimated EPS

Why is it Important?

Earnings surprises can have a huge impact on a company's stock price. Several studies suggest that positive earnings surprises not only lead to an immediate hike in a stock's price, but also to a gradual increase over time. Hence, it's not surprising that some companies are known for routinely beating earning projections. A negative earnings surprise will usually result in a decline in share price.

Next Day Price Change (%)

Next Regular trading session Closing price following Earnings result.

For After Market Close Earnings, It is a next trading day closing price. For Before Market Open Earnings, It is the same trading day closing price.

Why is it Important?

Next Day price change is a reaction of Earnings result.

PepsiCo’s Sales Are Recovering as Its Earnings Outlook Cracks

Posted on Oct 09, 2026 by Grayson Cavern

PepsiCo’s Sales Are Recovering as Its Earnings Outlook Cracks

PepsiCo (NASDAQ: PEP) has spent months getting punished for weak North American demand, and the Q3 earnings report gives shareholders a reason to question how much of that pessimism was justified. Organic revenue growth accelerated to its fastest pace since late 2023, global beverage and convenient-food volumes both expanded, and international operations delivered another strong quarter. Yet management lowered its full-year earnings outlook, even as it raised its revenue forecast.

That is a rough combination for a consumer-staples stock that investors buy for dependable growth. PEP closed October 9 at $127.82, down from its February high near $171, and the third-quarter report has done little to repair the chart. The business is selling more, but inflation, promotional spending and North American margin pressure are eating into the earnings investors actually own.

Revenue Growth Is Back, but North America Still Has Work to Do


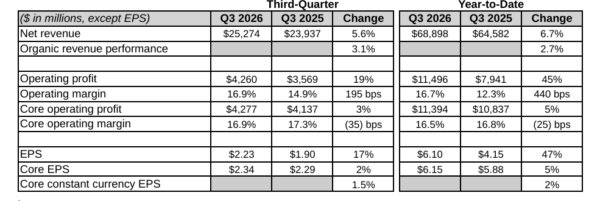
PepsiCo generated $25.27 billion in third-quarter revenue, up 5.6% year over year, while organic revenue increased 3.1%. Global beverage volume grew 3%, and convenient-food volume rose 1%; excluding certain commodity-oriented businesses in South Africa, convenient-food volume increased 4%, its strongest growth rate since 2021.
pepsico - StockEarnings

International operations are doing much of the heavy lifting. Organic revenue growth accelerated to 8%, with every international segment reporting growth. Asia Pacific Foods delivered 9% organic revenue growth, International Beverages Franchise posted 7%, and Europe, the Middle East and Africa recorded 9%. International core operating margin expanded 105 basis points as revenue growth and productivity savings flowed through the business.

North America remains a different proposition. PepsiCo Foods North America recorded a slight organic revenue decline, although U.S. savory and salty snacks gained volume. Its core operating margin contracted 280 basis points as affordability investments, higher advertising costs and the absence of a prior-year asset-sale gain weighed on profitability. PepsiCo Beverages North America posted 5% reported revenue growth, helped by acquisitions, while organic revenue slipped as declining volume offset effective pricing.

There is progress in the snack aisle, where U.S. salty-category volume has grown for four consecutive quarters, but the broader North American business has yet to produce the sustained improvement management wants. CEO Ramon Laguarta acknowledged that restoring growth and margins is taking longer than planned.

The Tariff Windfall Could Not Prevent an Earnings Downgrade

The headline EPS number offers a misleadingly comfortable read. GAAP EPS increased 17% to $2.23, while core EPS rose just 2% to $2.34. Core operating profit advanced 3%, but core operating margin fell 35 basis points to 16.9%.

PepsiCo received $178 million in tariff refunds during the quarter, but Management said those refunds supported core operating profit alongside productivity savings and effective pricing, partly offset by operating-cost inflation and higher advertising and marketing investment. Even with that benefit, margins contracted. North American Foods alone saw a 280-basis-point decline in core operating margin.

The pressure is now reflected in the full-year outlook. The company expects approximately 3% organic revenue growth and 6% reported revenue growth for fiscal 2026, but core EPS growth is projected at just 2.5% to 3.5%. Core constant-currency EPS growth is expected at 1% to 2%. Previously, management had forecast core EPS growth of 5% to 7% and core constant-currency growth of 4% to 6%.

The downgrade is the central development in this report – revenue guidance improved, helped by foreign exchange and acquisitions, while the earnings outlook weakened because North American margins remain under pressure. Management expects that pressure to continue into Q4, with productivity savings and tighter cost controls only partially offsetting it.

PepsiCo is also identifying additional structural cost reductions to fund innovation and brand investment. Those actions could help restore operating leverage, but shareholders need evidence that the savings are reaching the bottom line rather than being consumed by higher costs elsewhere.

PEP Has a Long Way to Go

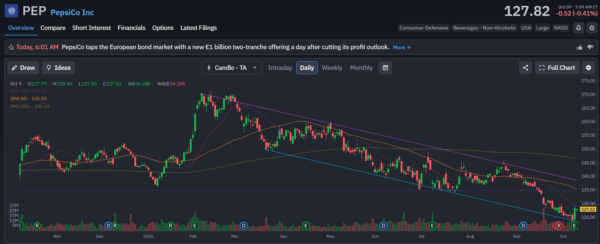
The technical picture remains bearish as PEP closed at $127.82, below its 20-day simple moving average at $129.20, its 50-day at $135.55 and its 200-day at $146.69. The descending trendline from the February peak remains intact, and the stock has broken well below the $135 area that previously acted as support.

The first level to reclaim is 129–130, around the 20-day average. A move through 135–136 would be a more convincing sign that buyers are regaining control, while the 200-day average near $147 remains the larger resistance zone. On the downside, $125 is the nearby level to watch; a decisive break could send PEP toward the low $120s.

I still see a case for buying PepsiCo, but the margin of safety has to come from price and the dividend while management works through its operating problems. At $127.82, the annualized $5.92 dividend yields approximately 4.6%, offering some income while investors wait for the business to improve.

The international operation is strong, and North American snack volumes are showing signs of life. The earnings downgrade, however, tells us the recovery is not reaching the bottom line quickly enough. I rate PEP a BUY, with $125 as the immediate support level and a reclaim of $130 as the first technical confirmation I would want to see. If North American margins continue to deteriorate, the low share price and dividend will not be enough to stop another leg down.
pepsico - StockEarnings

Join over 1.2M+ investors/traders who receive daily and weekly notable earnings alerts with predicted move
