ajax loader

Loading...


Ride-the-Wave Strategy – Best for Stock Traders

Ride-the-Wave targets multi-day price momentum following a company’s earnings announcement (EA). With this strategy:

  1. Buy a stock one day post-EA if a stock reacts positively post-earnings:
    1. Near the close of trading the EA-day for a pre-market-EA
    2. Near the close of the following day for a post-market-EA
  2. Sell-to-close after 7-10 days, or possibly earlier if a desired price target is reached

Similarly,

  1. short a stock one day post-EA if a stock reacts negatively post-earnings:
    1. near the close of trading the EA-day for a premarket-EA
    2. near the close of the following day for a post-market-EA
  2. then buy-to-close after 7-10 days, or possibly earlier if a desired price target is reached

Important: Ride-the-Wave is predicated on significant price momentum triggered by an EA. The 7-10 day scenario is the maximum trade hold-time. If you see post EA-momentum is halted or reversed by a significant opposite move, re-evaluate your presence in the trade.

This popular StockEarnings screen below will give you a list of stocks that historically exhibit significant price momentum following an EA for the next seven days:

  1. Stocks exhibiting positive post-EA price moves are buy-candidates
  2. Stocks exhibiting negative post-EA price moves are sell/short-candidates

The screen includes those stocks whose Earnings just came out in last two days.

Screen criteria:

  1. Earnings Date Start Date : Current Date + -1 Day
  2. Earnings Date End Date : Current Date + -2 Days
  3. Predicted Move (Next Day) Max : 7%
  4. Predicted Move (On 7th Day) Min : 7%

Strategy Guideline:

  1. Buy the stock if stock has reacted positively. Short the stock if stock has reacted negatively (see above).
  2. Close the position in 7-10 days, or possibly earlier based on price move.

Volatility Crush Strategy - Best for Options Traders

The Volatility Crush strategy is used with stocks that typically experience relatively low-to-moderate price moves (≤4%) following their Earnings Announcements (EA). The basic trade idea is to sell put or call options right before the EA, collecting a credit when options premium is very high due to elevated implied volatility (IV). You then close the position right after the EA by buying the option back much cheaper due to the significant drop in IV that occurs after the mystery of the EA disappears. In assessing this trade, you need to do your homework to ensure you collect sufficient premium to make the trade worthwhile.

This trade is practical due to the low-to-moderate price-move after the EA, which generally won’t significantly affect the options price, unlike an “action” stock, which experience great price moves post-EA. With these symbols, if you’re on the right side of the price move, that’s a great thing. But if you’re on the wrong side of the move, not so great. Consequently, by minimizing the effect of the post-EA price move, you have a much better chance to profit from the reduction in IV without it being ruined by a violent price move.

For this trade, open the position either (1) the night before the EA when the company announces earnings or (2) during the EA day when it announces post-market, generally capturing IV at or close to its peak.

For this trade, open the position either (1) the night before the EA when the company announces earnings or (2) during the EA day when it announces post-market, generally capturing IV at or close to its peak.

This popular stockearnings screen will give you a list of stocks which do not react more than 4% fpost-EA. It includes only those stocks whose earnings are releasing next day.

Screen criteria:

  1. Earnings Date Start Date : Current Date + 1
  2. Earnings Date End Date : Current Date + 1
  3. Predicted Move (Next Day) Max : 4%
  4. Options Type: Weekly

Strategy Guideline:

  1. Options Strategy: Sell Call and Put
  2. Options Strike Price: Current Stock Price – (% Predicated Move x 2)
  3. Expiration Date: It should generally be the closest expiry immediately after the EA.
  4. Buy Insurance: Buying back Call and Put at Strike price which 10% lower than Sell Strike Price is optional but recommended.

Watch Video for More Detail

Volatility Rush Strategy - Best for Options Traders

The Volatility Rush takes advantage of increasing options premiums into earnings announcements (EA) caused by an anticipated rise in Implied Volatility (IV). With this strategy, Buy a Call and Put at-the-money (a long straddle) 2-3 weeks before the EA when IV is lower. Sell the position either (1) the night before the EA when the company announces earnings pre-market, or (2) during the EA day when it announces post-market, generally capturing IV at or close to its peak.

This popular screen will give you a list of stocks whose Options premiums tend to rise into Earnings. It includes only those stocks whose Earnings are at least two weeks away from today.

Screen criteria:

  1. Earnings Date Start Date : Current Date + 15 Days
  2. Earnings Date End Date : Current Date + 30 Days
  3. Predicted Move (Next Day) Min : 5%
  4. Options Type: Weekly or Monthly if that lines up with the two to three-week lead-time for entering the trade

Strategy Guideline:

  1. Buy a Straddle at or close to the money two to three weeks pre-EA.
  2. Sell the position either the night before the EA when the company announces earnings pre-market, or during the EA day when it announces post-market.
  3. Expiration date should generally be the closest expiry immediately after the EA.
  4. Straddle price should not be more 60% of predicted move.

Predicted Move (Volatility)

Similar to Implied Volatility in Options. Expected volatility % based on our Proprietary Volatility Predication Model. We are expecting that stock price will likely to reach % in either direction by the end of next trading session after Earnings are released and not necessarily the closing volatility %.

Why is it important?

    This indicator helps

  1. Knowing expected volatility in stocks after Earnings helps to decide trading stocks before Earnings Announcement.
  2. Taking Advantage of volatility collapse following Earnings Results by using Advance Options strategies such as Spread and Straddles.

Since Last Earnings

Change in share price since last Earnings release.

Why is it Important?

When share has gained more than 10% since it's last Earning release, it tends to over react to minor bad news and give up some gains if not all. So, it contains more downside volatility than upside When share has dropped more than 10% since it's last Earning release, it tends to over react to minor good news and recover some drops if not all. So, it contains more upside volatility than downside.

EPS Surprise (%)

Occurs when a company's reported quarterly or annual profits are above or below analysts' expectations. Here is the formula to derive % EPS Surprice:

Actual EPS - Estimated EPS
------------------------------------- x 100
Estimated EPS

Why is it Important?

Earnings surprises can have a huge impact on a company's stock price. Several studies suggest that positive earnings surprises not only lead to an immediate hike in a stock's price, but also to a gradual increase over time. Hence, it's not surprising that some companies are known for routinely beating earning projections. A negative earnings surprise will usually result in a decline in share price.

Next Day Price Change (%)

Next Regular trading session Closing price following Earnings result.

For After Market Close Earnings, It is a next trading day closing price. For Before Market Open Earnings, It is the same trading day closing price.

Why is it Important?

Next Day price change is a reaction of Earnings result.

PepsiCo Earnings: PEP Is Pricing a Problem Bigger Than the Business

Posted on Oct 06, 2026 by Grayson Cavern

PepsiCo Earnings: PEP Is Pricing a Problem Bigger Than the Business

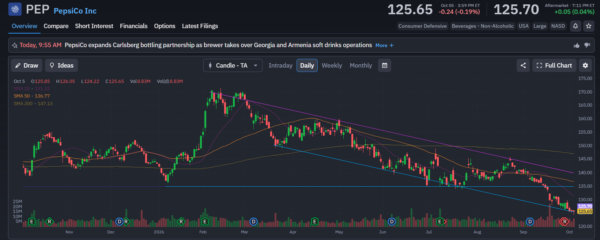
PepsiCo (NASDAQ:PEP) goes into Thursday’s earnings report at $125.65, roughly 26% below its February high of $171.48 and almost sitting on its 52-week low. The chart looks like a stock that has lost the plot, with PEP below its 20-day, 50-day, and 200-day moving averages, while every failed bounce has left sellers with another lower high.
pep - StockEarnings

Yet I see something a little useful under this wreckage. Its Q2 revenue rose 6.4% to $24.18 billion, and core EPS climbed 4% to $2.20, beating the $2.19 consensus. PepsiCo also said global organic volume was running at its strongest year-to-date pace since 2022. Yes, the stock barely cared, and so the gap between the operating data and the tape is where I want to explore today.

The North American Problem Is Already In The Price


The market has spent months hammering PepsiCo over weak North American demand, pricing pressure, and a consumer that has become more selective at the grocery aisle. The stock’s collapse tells me the Street has already built a fairly ugly scenario into the multiple.

Q2 still showed plenty of business outside that weak spot. PepsiCo Foods North America gained volume market share, helped by innovation and affordability initiatives, even as its reported revenue declined 2%. International operations were considerably stronger: International Beverages Franchise posted 9% organic growth with 5% volume growth, EMEA produced 6% organic growth and 4% volume growth, while Asia Pacific Foods delivered 9% organic growth and 10% volume growth. 

For Thursday’s report, I want the North American food business to stop losing ground while the international engine keeps carrying its share of the load. Another quarter of improving volume would give PepsiCo a healthier foundation for growth and reduce the dependence on pricing and acquisitions that helped produce the recent revenue numbers.

The consumer is still the pressure point, though, and PepsiCo has to prove that affordability initiatives are bringing people back without creating another hole in margins.

The Margin Squeeze Is The Second Tell

PepsiCo’s Q2 core operating profit increased 4%, but core operating margin slipped 40 basis points to 16.8%. Productivity savings and effective net pricing helped offset higher operating costs. 

I’m paying close attention to that spread because the company cannot repair its earnings profile through volume alone. It needs productivity to start showing up more forcefully in the P&L while it rebuilds demand in North America.

Management has already set a fairly modest 2026 framework: organic revenue growth of 2% to 4% and core constant-currency EPS growth of 4% to 6%, implying roughly 4% to 6% reported revenue growth and 5% to 7% core EPS growth. PepsiCo reaffirmed that framework after Q2. 

A clean Q3 beat would be nice. I’m more interested in management keeping that framework intact while showing that volume, pricing, and productivity are moving in the right direction.

Wall Street Has Been Lowering The Hurdle

The analyst tape has become increasingly forgiving. JPMorgan cut PEP from Overweight to Neutral and reduced its target from $170 to $138. UBS kept a Buy while cutting its target from $159 to $145. Wells Fargo moved $140 to $135, Evercore cut $150 to $135, and Barclays cut $142 to $133. 

Meanwhile, Wall Street expects roughly $2.30 in Q3 adjusted EPS on about $24.97 billion of revenue, representing roughly 4% year-over-year growth. Options are pricing roughly a 3.5% move around the print, which puts the implied range around $121 to $130. 

Look at what has happened while those expectations were being reset: PEP has fallen from $171.48 to $125.65. The 50-day SMA sits at $136.77, the 200-day at $147.13, and the stock has broken below the roughly $135 area that had previously acted as support.

A weak report that cuts guidance can send the stock through $125 and into the low $120s. A report that keeps guidance intact while showing better North American volume and tighter margins could put pressure on the traders who have been positioned for another deterioration.

The Stock Needs to Reclaim Key Technical Levels

The chart has not confirmed a reversal, and I don’t need to pretend it has. The first technical reclaim is $131-$132, around the 20-day SMA. Above $136-$137, the 50-day comes back into play. A sustained move toward $147 would put the 200-day SMA back on the board.

Those levels give me something concrete to trade around after the print instead of chasing a headline move. If buyers cannot reclaim the first layers of resistance, the downtrend remains intact. If the stock starts taking those levels back with volume behind the move, the tape will begin telling a different story.

There is also a $1.48 quarterly dividend, or $5.92 annualized, following PepsiCo’s 4% increase in 2026 and its 54th consecutive annual dividend increase. At $125.65, that works out to roughly a 4.7% yield. 

I’m buying here because the stock has already absorbed a brutal expectation reset while parts of the operating business are showing early signs of stabilization. The international volume is there. North American market share has improved. Management has reaffirmed its full-year framework. Analysts have been cutting targets heading into the report.

If PepsiCo shows me that the business is beginning to turn before the stock does, $125 could end up looking less like the start of another leg lower and more like the level where the pessimism finally became excessive.


Join over 1.2M+ investors/traders who receive daily and weekly notable earnings alerts with predicted move