ajax loader

Loading...


Ride-the-Wave Strategy – Best for Stock Traders

Ride-the-Wave targets multi-day price momentum following a company’s earnings announcement (EA). With this strategy:

  1. Buy a stock one day post-EA if a stock reacts positively post-earnings:
    1. Near the close of trading the EA-day for a pre-market-EA
    2. Near the close of the following day for a post-market-EA
  2. Sell-to-close after 7-10 days, or possibly earlier if a desired price target is reached

Similarly,

  1. short a stock one day post-EA if a stock reacts negatively post-earnings:
    1. near the close of trading the EA-day for a premarket-EA
    2. near the close of the following day for a post-market-EA
  2. then buy-to-close after 7-10 days, or possibly earlier if a desired price target is reached

Important: Ride-the-Wave is predicated on significant price momentum triggered by an EA. The 7-10 day scenario is the maximum trade hold-time. If you see post EA-momentum is halted or reversed by a significant opposite move, re-evaluate your presence in the trade.

This popular StockEarnings screen below will give you a list of stocks that historically exhibit significant price momentum following an EA for the next seven days:

  1. Stocks exhibiting positive post-EA price moves are buy-candidates
  2. Stocks exhibiting negative post-EA price moves are sell/short-candidates

The screen includes those stocks whose Earnings just came out in last two days.

Screen criteria:

  1. Earnings Date Start Date : Current Date + -1 Day
  2. Earnings Date End Date : Current Date + -2 Days
  3. Predicted Move (Next Day) Max : 7%
  4. Predicted Move (On 7th Day) Min : 7%

Strategy Guideline:

  1. Buy the stock if stock has reacted positively. Short the stock if stock has reacted negatively (see above).
  2. Close the position in 7-10 days, or possibly earlier based on price move.

Volatility Crush Strategy - Best for Options Traders

The Volatility Crush strategy is used with stocks that typically experience relatively low-to-moderate price moves (≤4%) following their Earnings Announcements (EA). The basic trade idea is to sell put or call options right before the EA, collecting a credit when options premium is very high due to elevated implied volatility (IV). You then close the position right after the EA by buying the option back much cheaper due to the significant drop in IV that occurs after the mystery of the EA disappears. In assessing this trade, you need to do your homework to ensure you collect sufficient premium to make the trade worthwhile.

This trade is practical due to the low-to-moderate price-move after the EA, which generally won’t significantly affect the options price, unlike an “action” stock, which experience great price moves post-EA. With these symbols, if you’re on the right side of the price move, that’s a great thing. But if you’re on the wrong side of the move, not so great. Consequently, by minimizing the effect of the post-EA price move, you have a much better chance to profit from the reduction in IV without it being ruined by a violent price move.

For this trade, open the position either (1) the night before the EA when the company announces earnings or (2) during the EA day when it announces post-market, generally capturing IV at or close to its peak.

For this trade, open the position either (1) the night before the EA when the company announces earnings or (2) during the EA day when it announces post-market, generally capturing IV at or close to its peak.

This popular stockearnings screen will give you a list of stocks which do not react more than 4% fpost-EA. It includes only those stocks whose earnings are releasing next day.

Screen criteria:

  1. Earnings Date Start Date : Current Date + 1
  2. Earnings Date End Date : Current Date + 1
  3. Predicted Move (Next Day) Max : 4%
  4. Options Type: Weekly

Strategy Guideline:

  1. Options Strategy: Sell Call and Put
  2. Options Strike Price: Current Stock Price – (% Predicated Move x 2)
  3. Expiration Date: It should generally be the closest expiry immediately after the EA.
  4. Buy Insurance: Buying back Call and Put at Strike price which 10% lower than Sell Strike Price is optional but recommended.

Watch Video for More Detail

Volatility Rush Strategy - Best for Options Traders

The Volatility Rush takes advantage of increasing options premiums into earnings announcements (EA) caused by an anticipated rise in Implied Volatility (IV). With this strategy, Buy a Call and Put at-the-money (a long straddle) 2-3 weeks before the EA when IV is lower. Sell the position either (1) the night before the EA when the company announces earnings pre-market, or (2) during the EA day when it announces post-market, generally capturing IV at or close to its peak.

This popular screen will give you a list of stocks whose Options premiums tend to rise into Earnings. It includes only those stocks whose Earnings are at least two weeks away from today.

Screen criteria:

  1. Earnings Date Start Date : Current Date + 15 Days
  2. Earnings Date End Date : Current Date + 30 Days
  3. Predicted Move (Next Day) Min : 5%
  4. Options Type: Weekly or Monthly if that lines up with the two to three-week lead-time for entering the trade

Strategy Guideline:

  1. Buy a Straddle at or close to the money two to three weeks pre-EA.
  2. Sell the position either the night before the EA when the company announces earnings pre-market, or during the EA day when it announces post-market.
  3. Expiration date should generally be the closest expiry immediately after the EA.
  4. Straddle price should not be more 60% of predicted move.

Predicted Move (Volatility)

Similar to Implied Volatility in Options. Expected volatility % based on our Proprietary Volatility Predication Model. We are expecting that stock price will likely to reach % in either direction by the end of next trading session after Earnings are released and not necessarily the closing volatility %.

Why is it important?

    This indicator helps

  1. Knowing expected volatility in stocks after Earnings helps to decide trading stocks before Earnings Announcement.
  2. Taking Advantage of volatility collapse following Earnings Results by using Advance Options strategies such as Spread and Straddles.

Since Last Earnings

Change in share price since last Earnings release.

Why is it Important?

When share has gained more than 10% since it's last Earning release, it tends to over react to minor bad news and give up some gains if not all. So, it contains more downside volatility than upside When share has dropped more than 10% since it's last Earning release, it tends to over react to minor good news and recover some drops if not all. So, it contains more upside volatility than downside.

EPS Surprise (%)

Occurs when a company's reported quarterly or annual profits are above or below analysts' expectations. Here is the formula to derive % EPS Surprice:

Actual EPS - Estimated EPS
------------------------------------- x 100
Estimated EPS

Why is it Important?

Earnings surprises can have a huge impact on a company's stock price. Several studies suggest that positive earnings surprises not only lead to an immediate hike in a stock's price, but also to a gradual increase over time. Hence, it's not surprising that some companies are known for routinely beating earning projections. A negative earnings surprise will usually result in a decline in share price.

Next Day Price Change (%)

Next Regular trading session Closing price following Earnings result.

For After Market Close Earnings, It is a next trading day closing price. For Before Market Open Earnings, It is the same trading day closing price.

Why is it Important?

Next Day price change is a reaction of Earnings result.

Could Kohl’s (KSS) Stock Be Your Favorite Bearish Target?

Posted on Oct 06, 2026 by Joshua Enomoto

Could Kohl’s (KSS) Stock Be Your Favorite Bearish Target?

When I first saw the quantitative setup for Kohl’s (NYSE: KSS), my mind rejected it as highly implausible, if not outright impossible. While the fundamental case for KSS stock may be reasonably criticized — especially amid the current macro environment — there’s no denying that the equity has become a favorite meme play. It goes up even though there doesn’t seem to be a good reason for it.

At the same time, there’s the school of thought that a ticker can only overcome gravity for so long. You can talk about short squeezes until you’re blue in the face. Usually, when traders are willing to bet against a security, there’s conviction behind the transaction. In the case of KSS stock, its short interest stands at nearly 30% of its float, which is gargantuan.

No wonder why Kohl’s stock draws so much attention. With short interest exposure of that magnitude, there’s a risk of retail traders bidding up KSS out of spite. If that happens, a short squeeze may materialize, which involves bearish traders covering their short positions by buying back the equity. Of course, because of heightened demand due to collective panic, these traders will be acquiring shares at increasingly higher levels.

That’s good for the bulls and obviously not so much for the bears. The problem, though, is that the timing of such activities isn’t always consistent. Otherwise, KSS stock wouldn’t have a year-to-date loss of more than 4%.

So, in the interest of time, here’s my 20-second elevator pitch. Right now, KSS stock has flashed a rare quantitative setup, which historically suggests steep downside for the ticker. Adding to the concerns, there appears to be technical resistance at the $19 to $20 level. If historical fears turn out to be accurate, the 16/14 bear put spread expiring Dec. 18 (which is about 11 weeks away) could be a legitimate target.

Why the $14 Second-Leg Strike for KSS Stock?


Naturally, the first question that may pop up for traders is, why the 16/14 bear spread expiring for the December monthly chain? Mechanically, I’m looking at a combination of a low entry price and a reasonably high payout.

Let’s just be real and state upfront that the U.S. equities market generally has an upward bias. That bias usually applies to blue chips and not names like Kohl’s stock. But because KSS is a popular meme play, there is nevertheless a true risk in betting against the ticker.

Still, the debit-side bear put spread makes such plays intriguing. First, the net debit (cash outlay) required per spread is only $75. If KSS stock happens to catch a bullish wave and the spread completely blows up, the most that can be lost is the $75 you put in. However, the payout is asymmetric in your favor. Should KSS trigger the second-leg strike on expiration, the maximum payout clocks in at $125.

Basically, you have a chance of getting back more than you risk. That’s important because under risk management theory in the equities market, you stand a better chance of success if you keep your losses small but your payouts massive.

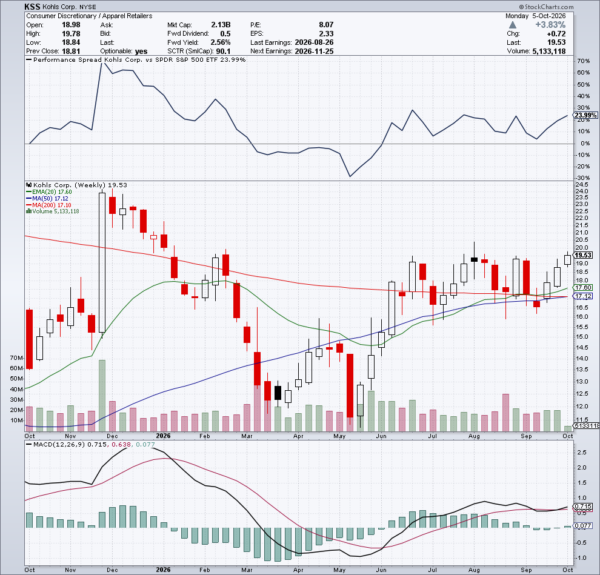
As for the reason why the bear spread itself may be the appropriate transaction, the discipline of technical analysis may offer supporting evidence. If you look at a weekly chart of Kohl’s stock, you’ll notice that since late June, there have been three distinct attempts to break out of the $19 to $20 resistance level, with each time resulting in failure.
kss stock
Source: StockCharts

Currently, KSS stock is bouncing against this resistance level again. The assumption, of course, is that the fourth time may not be the charm. If not, the bears could get ambitious and break below the $16.50 support level and possibly down to $14 by the December monthly expiration date.

Probability Matters for KSS Stock (But in a Nuanced Way)

To be clear, risk management is a key part of options-related success, but I would argue that it’s not the only methodology. In my opinion, you can’t just risk manage your way to riches because you still need to “probabilize” the problem at hand. In other words, if you have correct risk management but the wrong probabilistic framework, your trade will likely end in failure.

However, we can’t just rely on universal claims of high-probability trades because the discipline isn’t purely scientific. Sure, the mathematical structure behind probabilistic axioms are legitimate — they produce the outcomes they claim to produce. But the question of which framework to use is at least partly philosophical.

Ultimately, we don’t really care about defining specific equities as “bullish” or “bearish,” as these assets are not static. Most will agree that valuations go through transitions. What appears to be a terrible investment one year can be a lightning rod the next.

So, as options traders, we shouldn’t worry about the current label of KSS stock. What matters is the probability of transition from its current state to its future state.

To put it bluntly, what I’m concerned about with Kohl’s stock is the likelihood of it transitioning to a bearish state, even though right now, circumstances look good. Even a shutdown relief pitcher can get touched up if he’s tipping his pitches.

What Makes KSS Susceptible to a Downturn?

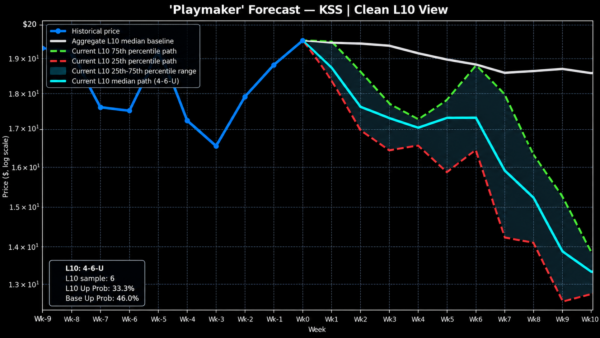
What then would make KSS stock susceptible to a downturn? The answer lies in its contradictory quantitative setup. In the last two months, KSS has printed 10 weekly candlesticks, with only four of them leading to net positive price action. Stated differently, within the defined period, 60% of the unit-wise volume incurred drawdowns.
kss stock

That would ordinarily be considered bearish. However, the overall slope across the 10-week period was positive, not negative. So, we have a contradiction: positive slope but with more down weeks than up within the aforementioned timeframe.

Why is that concerning? Because of the six times that this setup has flashed since January 2022, KSS stock has usually witnessed a dramatic falloff, with enough frequency that there may be an 83% chance that the ticker slips below the $14 level by the 10th week. Subsequently, it’s not much of a stretch to assume that the bearish target could be triggered on Dec. 18.

Of course, such a horrendous forecast assumes that history will repeat itself — something that is never guaranteed. But if it does, KSS stock may be looking at a heap of trouble.


Joshua Enomoto is a seasoned financial writer with a strong track record of in-depth stock analysis, offering clear, insightful commentary for retail investors across all levels of expertise. Renowned for his ability to blend analytical rigor with engaging wit, Joshua's work has been featured on leading investment platforms, including TipRanks, InvestorPlace, Barchart, Benzinga, and Fintel. He was also handpicked to spearhead high-impact initiatives such as InvestorPlace's "Trade of the Day" and Benzinga’s ETF coverage. As a frequent guest expert for CGTN America, Joshua discusses a wide range of economic, societal, and consumer market trends. A graduate of U.C. San Diego, Joshua brings a thoughtful and fresh perspective to complex financial narratives, helping enterprise clients connect with their audiences. He also composes music in his spare time.

Join over 1.2M+ investors/traders who receive daily and weekly notable earnings alerts with predicted move