ajax loader

Loading...


Ride-the-Wave Strategy – Best for Stock Traders

Ride-the-Wave targets multi-day price momentum following a company’s earnings announcement (EA). With this strategy:

  1. Buy a stock one day post-EA if a stock reacts positively post-earnings:
    1. Near the close of trading the EA-day for a pre-market-EA
    2. Near the close of the following day for a post-market-EA
  2. Sell-to-close after 7-10 days, or possibly earlier if a desired price target is reached

Similarly,

  1. short a stock one day post-EA if a stock reacts negatively post-earnings:
    1. near the close of trading the EA-day for a premarket-EA
    2. near the close of the following day for a post-market-EA
  2. then buy-to-close after 7-10 days, or possibly earlier if a desired price target is reached

Important: Ride-the-Wave is predicated on significant price momentum triggered by an EA. The 7-10 day scenario is the maximum trade hold-time. If you see post EA-momentum is halted or reversed by a significant opposite move, re-evaluate your presence in the trade.

This popular StockEarnings screen below will give you a list of stocks that historically exhibit significant price momentum following an EA for the next seven days:

  1. Stocks exhibiting positive post-EA price moves are buy-candidates
  2. Stocks exhibiting negative post-EA price moves are sell/short-candidates

The screen includes those stocks whose Earnings just came out in last two days.

Screen criteria:

  1. Earnings Date Start Date : Current Date + -1 Day
  2. Earnings Date End Date : Current Date + -2 Days
  3. Predicted Move (Next Day) Max : 7%
  4. Predicted Move (On 7th Day) Min : 7%

Strategy Guideline:

  1. Buy the stock if stock has reacted positively. Short the stock if stock has reacted negatively (see above).
  2. Close the position in 7-10 days, or possibly earlier based on price move.

Volatility Crush Strategy - Best for Options Traders

The Volatility Crush strategy is used with stocks that typically experience relatively low-to-moderate price moves (≤4%) following their Earnings Announcements (EA). The basic trade idea is to sell put or call options right before the EA, collecting a credit when options premium is very high due to elevated implied volatility (IV). You then close the position right after the EA by buying the option back much cheaper due to the significant drop in IV that occurs after the mystery of the EA disappears. In assessing this trade, you need to do your homework to ensure you collect sufficient premium to make the trade worthwhile.

This trade is practical due to the low-to-moderate price-move after the EA, which generally won’t significantly affect the options price, unlike an “action” stock, which experience great price moves post-EA. With these symbols, if you’re on the right side of the price move, that’s a great thing. But if you’re on the wrong side of the move, not so great. Consequently, by minimizing the effect of the post-EA price move, you have a much better chance to profit from the reduction in IV without it being ruined by a violent price move.

For this trade, open the position either (1) the night before the EA when the company announces earnings or (2) during the EA day when it announces post-market, generally capturing IV at or close to its peak.

For this trade, open the position either (1) the night before the EA when the company announces earnings or (2) during the EA day when it announces post-market, generally capturing IV at or close to its peak.

This popular stockearnings screen will give you a list of stocks which do not react more than 4% fpost-EA. It includes only those stocks whose earnings are releasing next day.

Screen criteria:

  1. Earnings Date Start Date : Current Date + 1
  2. Earnings Date End Date : Current Date + 1
  3. Predicted Move (Next Day) Max : 4%
  4. Options Type: Weekly

Strategy Guideline:

  1. Options Strategy: Sell Call and Put
  2. Options Strike Price: Current Stock Price – (% Predicated Move x 2)
  3. Expiration Date: It should generally be the closest expiry immediately after the EA.
  4. Buy Insurance: Buying back Call and Put at Strike price which 10% lower than Sell Strike Price is optional but recommended.

Watch Video for More Detail

Volatility Rush Strategy - Best for Options Traders

The Volatility Rush takes advantage of increasing options premiums into earnings announcements (EA) caused by an anticipated rise in Implied Volatility (IV). With this strategy, Buy a Call and Put at-the-money (a long straddle) 2-3 weeks before the EA when IV is lower. Sell the position either (1) the night before the EA when the company announces earnings pre-market, or (2) during the EA day when it announces post-market, generally capturing IV at or close to its peak.

This popular screen will give you a list of stocks whose Options premiums tend to rise into Earnings. It includes only those stocks whose Earnings are at least two weeks away from today.

Screen criteria:

  1. Earnings Date Start Date : Current Date + 15 Days
  2. Earnings Date End Date : Current Date + 30 Days
  3. Predicted Move (Next Day) Min : 5%
  4. Options Type: Weekly or Monthly if that lines up with the two to three-week lead-time for entering the trade

Strategy Guideline:

  1. Buy a Straddle at or close to the money two to three weeks pre-EA.
  2. Sell the position either the night before the EA when the company announces earnings pre-market, or during the EA day when it announces post-market.
  3. Expiration date should generally be the closest expiry immediately after the EA.
  4. Straddle price should not be more 60% of predicted move.

Predicted Move (Volatility)

Similar to Implied Volatility in Options. Expected volatility % based on our Proprietary Volatility Predication Model. We are expecting that stock price will likely to reach % in either direction by the end of next trading session after Earnings are released and not necessarily the closing volatility %.

Why is it important?

    This indicator helps

  1. Knowing expected volatility in stocks after Earnings helps to decide trading stocks before Earnings Announcement.
  2. Taking Advantage of volatility collapse following Earnings Results by using Advance Options strategies such as Spread and Straddles.

Since Last Earnings

Change in share price since last Earnings release.

Why is it Important?

When share has gained more than 10% since it's last Earning release, it tends to over react to minor bad news and give up some gains if not all. So, it contains more downside volatility than upside When share has dropped more than 10% since it's last Earning release, it tends to over react to minor good news and recover some drops if not all. So, it contains more upside volatility than downside.

EPS Surprise (%)

Occurs when a company's reported quarterly or annual profits are above or below analysts' expectations. Here is the formula to derive % EPS Surprice:

Actual EPS - Estimated EPS
------------------------------------- x 100
Estimated EPS

Why is it Important?

Earnings surprises can have a huge impact on a company's stock price. Several studies suggest that positive earnings surprises not only lead to an immediate hike in a stock's price, but also to a gradual increase over time. Hence, it's not surprising that some companies are known for routinely beating earning projections. A negative earnings surprise will usually result in a decline in share price.

Next Day Price Change (%)

Next Regular trading session Closing price following Earnings result.

For After Market Close Earnings, It is a next trading day closing price. For Before Market Open Earnings, It is the same trading day closing price.

Why is it Important?

Next Day price change is a reaction of Earnings result.

Lululemon Taps Athleta CEO in Reset: Is LULU Stock a Buy or a Trade?

Posted on Oct 08, 2026 by Chris Markoch

Lululemon Taps Athleta CEO in Reset: Is LULU Stock a Buy or a Trade?

Lululemon Athletica (NASDAQ: LULU) stock investors just got their first look at Heidi O’Neill’s turnaround playbook. On September 30, Lululemon named Athleta CEO Maggie Gauger as its new president and chief product officer.

The newly created role takes effect October 26. It puts design, merchandising, footwear, product innovation and materials science under one leader. Lululemon also hired Walmart Canada’s Joseph Godsey as chief operating officer. Two senior executives are leaving. Searches are underway for brand, communications and technology chiefs.

O’Neill took over as CEO on September 8. She is barely a month into the job. Yet she is already rebuilding the leadership bench. These moves are likely the first of several designed to breathe life into a troubled brand.

There’s a familiar thread here. O’Neill and Gauger are both Nike veterans. Gauger ran Nike’s North America women’s business before taking over Athleta in 2025. In other words, Lululemon just hired the executive running one of its direct competitors.

The question for investors is timing. Should you buy LULU stock on the leadership news? Or should you wait for proof the brand is regaining traction? Right now, both the options market and the chart suggest Lululemon may be a better trade than an investment.

Lululemon’s Real Problem Is Competition


Lululemon helped invent the athleisure category. It turned $100 leggings into a status symbol. But success attracts a crowd. Alo Yoga and Vuori built devoted followings. Nike and Athleta pushed harder into women’s activewear. Lower-priced dupes flooded social media.

Lululemon was slow to respond, and arguably slow to see it coming. Its core assortment started to look stale while rivals moved faster on style. In the second quarter, comparable sales fell 9%. Every geography posted negative comps. Americas revenue dropped 8%. Management pointed to weaker store traffic and inconsistent product launches.

China was supposed to be the offset. Instead, growth there has slowed. Much of the recent gain has come from new stores rather than stronger sales at existing locations. That’s not the organic demand investors were counting on.

lululemon - StockEarnings

The result was the second guidance cut this year. Lululemon now expects fiscal 2026 revenue of $10.35 billion to $10.5 billion, a 5% to 7% decline. Third-quarter guidance calls for revenue down 10% to 11%. Earnings per share (EPS) is expected at 93 cents to 98 cents, versus $2.59 a year ago. Shares fell about 15% the next day.

A Cheap Stock With a Broken Story

On paper, LULU looks cheap. At about $92, the stock trades under 10 times the midpoint of full-year EPS guidance.

That guidance includes 86 cents per share in one-time tariff refunds. Strip those out, and the multiple is closer to 10.5 times. That’s still inexpensive for a brand with Lululemon’s margins and loyalty.

The balance sheet gives O’Neill room to work. Lululemon ended the quarter with about $1.4 billion in cash. Free cash flow rose sharply, and the company kept buying back stock.

But a low multiple on shrinking earnings isn’t a bargain. It’s a value trap until the trend turns. Gauger’s hire targets the right problem, which is product. However, new product takes seasons, not weeks, to reach shelves. The December report will mostly reflect decisions made before she arrived.

Trading Lululemon’s December Earnings With Options

Lululemon is expected to report third-quarter results around December 3. The December 18 expiration captures that event. As of the Oct. 7 close, at-the-money December options carry implied volatility near 50%.

That makes options expensive. The $90 straddle costs about $16.77, roughly 18% of the share price. A straddle buyer needs LULU below $73 or above $107 at expiration just to break even.

Positioning leans defensive. Across the most active strikes, put open interest totals roughly 14,300 contracts versus about 5,200 for calls. The $75 put carries the largest open interest at 3,647 contracts. That looks like institutional hedging, not speculation.

The most active contract was the $100 call, with 147 contracts across 27 trades. But 121 of those traded at the bid. That points to sellers, possibly holders writing covered calls. They don’t appear to expect a quick move above $100.

With implied volatility this high, defined-risk spreads make more sense than buying options outright. Two examples based on Oct. 7 closing prices:

  • Bullish call spread: Buy the $100 call and sell the $110 call for about $2.76. Maximum gain is $7.24 if LULU closes above $110. Breakeven is roughly $102.76.
  • Bearish put spread: Buy the $90 put and sell the $75 put for about $4.56. Maximum gain is about $10.44 below $75. Breakeven is roughly $85.45.

Selling the short leg offsets part of the volatility premium. Note that these are last-trade prices. Actual fills will vary with the bid-ask spread.

Technical Analysis: Oversold, But Still in a Downtrend

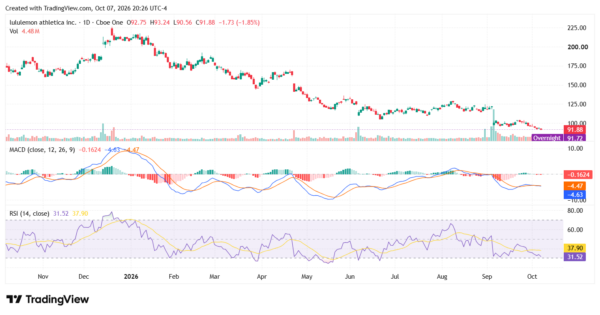
The chart tells the same story as the fundamentals. LULU has posted a series of lower highs since peaking near $225 in December 2025. At $91.88, the stock is down nearly 60% from that high.

The September earnings gap took shares from the low $120s to around $100. A brief bounce stalled near $103. The stock has since broken below that post-gap range to fresh 52-week lows.

The relative strength index (RSI) sits at 31.5, just above the oversold threshold of 30. Over the past year, RSI readings near 30 in April, May, and June produced sharp but short-lived bounces. None of them reversed the larger trend.

The MACD line is at -4.63, just below its signal line at -4.47. The histogram is slightly negative. Momentum remains bearish but is flattening. A cross back above the signal line would be the first sign of a turn.

Resistance sits at $100, a round number and the post-gap shelf. Above that, $105 to $110 is the next hurdle. The unfilled gap near $120 is the bigger target. On the downside, $90 is psychological support. Below that, watch $85 and the $75 level where put open interest clusters.

An oversold bounce toward $100 is plausible. That’s a trade. A trend reversal would require a close above $105 and a higher high. That’s an investment signal, and it isn’t here yet.
lululemon - StockEarnings

Should Investors Buy the News or Wait?

Maggie Gauger is the right kind of hire. She has worked to rebuild a women’s activewear brand and knows the competitive landscape from the inside. Heidi O’Neill is clearly moving fast.

But investors don’t get paid for being early to a turnaround. They get paid for being right. The confirmation signals are clear: stabilizing comparable sales, a bottom in China, and products that generate buzz again. Those likely won’t show up until 2027.

Until then, LULU stock looks like a vehicle for traders, not a core holding. Long-term investors can afford to wait for proof. The stock may cost more when that proof arrives, but the risk will be far lower.


A former marketing copywriter turned freelance financial writer and market analyst. I have a passion for delivering insights to investors. I write regularly about stocks for StockEarnings and MarketBeat. Posts are not advice.

Join over 1.2M+ investors/traders who receive daily and weekly notable earnings alerts with predicted move