ajax loader

Loading...


Ride-the-Wave Strategy – Best for Stock Traders

Ride-the-Wave targets multi-day price momentum following a company’s earnings announcement (EA). With this strategy:

  1. Buy a stock one day post-EA if a stock reacts positively post-earnings:
    1. Near the close of trading the EA-day for a pre-market-EA
    2. Near the close of the following day for a post-market-EA
  2. Sell-to-close after 7-10 days, or possibly earlier if a desired price target is reached

Similarly,

  1. short a stock one day post-EA if a stock reacts negatively post-earnings:
    1. near the close of trading the EA-day for a premarket-EA
    2. near the close of the following day for a post-market-EA
  2. then buy-to-close after 7-10 days, or possibly earlier if a desired price target is reached

Important: Ride-the-Wave is predicated on significant price momentum triggered by an EA. The 7-10 day scenario is the maximum trade hold-time. If you see post EA-momentum is halted or reversed by a significant opposite move, re-evaluate your presence in the trade.

This popular StockEarnings screen below will give you a list of stocks that historically exhibit significant price momentum following an EA for the next seven days:

  1. Stocks exhibiting positive post-EA price moves are buy-candidates
  2. Stocks exhibiting negative post-EA price moves are sell/short-candidates

The screen includes those stocks whose Earnings just came out in last two days.

Screen criteria:

  1. Earnings Date Start Date : Current Date + -1 Day
  2. Earnings Date End Date : Current Date + -2 Days
  3. Predicted Move (Next Day) Max : 7%
  4. Predicted Move (On 7th Day) Min : 7%

Strategy Guideline:

  1. Buy the stock if stock has reacted positively. Short the stock if stock has reacted negatively (see above).
  2. Close the position in 7-10 days, or possibly earlier based on price move.

Volatility Crush Strategy - Best for Options Traders

The Volatility Crush strategy is used with stocks that typically experience relatively low-to-moderate price moves (≤4%) following their Earnings Announcements (EA). The basic trade idea is to sell put or call options right before the EA, collecting a credit when options premium is very high due to elevated implied volatility (IV). You then close the position right after the EA by buying the option back much cheaper due to the significant drop in IV that occurs after the mystery of the EA disappears. In assessing this trade, you need to do your homework to ensure you collect sufficient premium to make the trade worthwhile.

This trade is practical due to the low-to-moderate price-move after the EA, which generally won’t significantly affect the options price, unlike an “action” stock, which experience great price moves post-EA. With these symbols, if you’re on the right side of the price move, that’s a great thing. But if you’re on the wrong side of the move, not so great. Consequently, by minimizing the effect of the post-EA price move, you have a much better chance to profit from the reduction in IV without it being ruined by a violent price move.

For this trade, open the position either (1) the night before the EA when the company announces earnings or (2) during the EA day when it announces post-market, generally capturing IV at or close to its peak.

For this trade, open the position either (1) the night before the EA when the company announces earnings or (2) during the EA day when it announces post-market, generally capturing IV at or close to its peak.

This popular stockearnings screen will give you a list of stocks which do not react more than 4% fpost-EA. It includes only those stocks whose earnings are releasing next day.

Screen criteria:

  1. Earnings Date Start Date : Current Date + 1
  2. Earnings Date End Date : Current Date + 1
  3. Predicted Move (Next Day) Max : 4%
  4. Options Type: Weekly

Strategy Guideline:

  1. Options Strategy: Sell Call and Put
  2. Options Strike Price: Current Stock Price – (% Predicated Move x 2)
  3. Expiration Date: It should generally be the closest expiry immediately after the EA.
  4. Buy Insurance: Buying back Call and Put at Strike price which 10% lower than Sell Strike Price is optional but recommended.

Watch Video for More Detail

Volatility Rush Strategy - Best for Options Traders

The Volatility Rush takes advantage of increasing options premiums into earnings announcements (EA) caused by an anticipated rise in Implied Volatility (IV). With this strategy, Buy a Call and Put at-the-money (a long straddle) 2-3 weeks before the EA when IV is lower. Sell the position either (1) the night before the EA when the company announces earnings pre-market, or (2) during the EA day when it announces post-market, generally capturing IV at or close to its peak.

This popular screen will give you a list of stocks whose Options premiums tend to rise into Earnings. It includes only those stocks whose Earnings are at least two weeks away from today.

Screen criteria:

  1. Earnings Date Start Date : Current Date + 15 Days
  2. Earnings Date End Date : Current Date + 30 Days
  3. Predicted Move (Next Day) Min : 5%
  4. Options Type: Weekly or Monthly if that lines up with the two to three-week lead-time for entering the trade

Strategy Guideline:

  1. Buy a Straddle at or close to the money two to three weeks pre-EA.
  2. Sell the position either the night before the EA when the company announces earnings pre-market, or during the EA day when it announces post-market.
  3. Expiration date should generally be the closest expiry immediately after the EA.
  4. Straddle price should not be more 60% of predicted move.

Predicted Move (Volatility)

Similar to Implied Volatility in Options. Expected volatility % based on our Proprietary Volatility Predication Model. We are expecting that stock price will likely to reach % in either direction by the end of next trading session after Earnings are released and not necessarily the closing volatility %.

Why is it important?

    This indicator helps

  1. Knowing expected volatility in stocks after Earnings helps to decide trading stocks before Earnings Announcement.
  2. Taking Advantage of volatility collapse following Earnings Results by using Advance Options strategies such as Spread and Straddles.

Since Last Earnings

Change in share price since last Earnings release.

Why is it Important?

When share has gained more than 10% since it's last Earning release, it tends to over react to minor bad news and give up some gains if not all. So, it contains more downside volatility than upside When share has dropped more than 10% since it's last Earning release, it tends to over react to minor good news and recover some drops if not all. So, it contains more upside volatility than downside.

EPS Surprise (%)

Occurs when a company's reported quarterly or annual profits are above or below analysts' expectations. Here is the formula to derive % EPS Surprice:

Actual EPS - Estimated EPS
------------------------------------- x 100
Estimated EPS

Why is it Important?

Earnings surprises can have a huge impact on a company's stock price. Several studies suggest that positive earnings surprises not only lead to an immediate hike in a stock's price, but also to a gradual increase over time. Hence, it's not surprising that some companies are known for routinely beating earning projections. A negative earnings surprise will usually result in a decline in share price.

Next Day Price Change (%)

Next Regular trading session Closing price following Earnings result.

For After Market Close Earnings, It is a next trading day closing price. For Before Market Open Earnings, It is the same trading day closing price.

Why is it Important?

Next Day price change is a reaction of Earnings result.

Lamb Weston Q1 Earnings: A Potato Squeeze Could Drive LW Stock Higher

Posted on Oct 07, 2026 by Grayson Cavern

Lamb Weston Q1 Earnings: A Potato Squeeze Could Drive LW Stock Higher

Lamb Weston Holdings Inc (NYSE: LW) has spent the last year fighting a nasty combination of weak restaurant traffic, customer destocking, falling price/mix, and bloated potato inventories across the industry. The latest Q1 FY2027 earnings report finally gives shareholders something more useful than another promise of improvement: North American volume is accelerating while the potato market is moving toward tighter supply.

That creates an unusual setup for a company whose earnings have been dragged lower by pricing and input costs. LW grew companywide sales volume 2% in Q1, North American volume 6.7%, and North America delivered 11% growth in adjusted EBITDA. Yet company-wide adjusted EBITDA still fell 5% to $286 million because Europe remained under pressure.

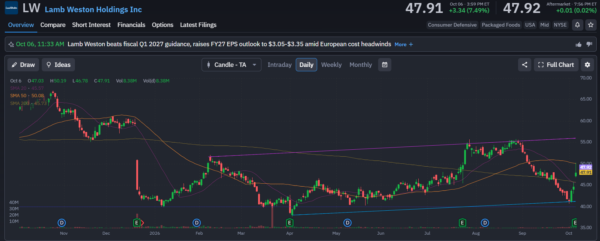
The stock responded accordingly, jumping 7.49% to $47.91 on October 6, with 8.38 million shares changing hands. After months of selling, the tape is starting to price something different.

North America Is Already Doing The Heavy Lifting


The most important number in Lamb Weston’s Q1 report isn’t the $1.67 billion of revenue or the $0.75 of adjusted EPS. It’s the seventh consecutive quarter of North American volume growth.

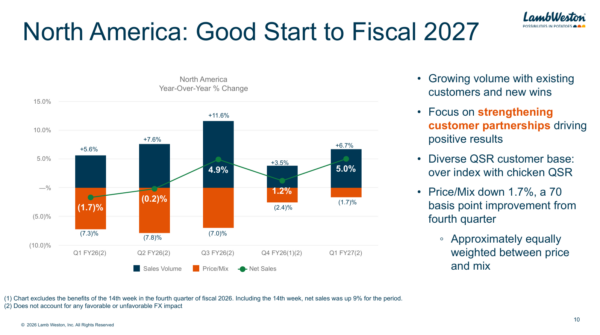
North American sales rose 5%, powered by 6.7% volume growth, while price/mix was still negative 1.7%. Management said volume growth came from existing customers, new wins, and a strong mix of QSR relationships, with the company particularly exposed to chicken-focused chains. U.S. restaurant traffic was essentially flat and QSR traffic declined 1%, yet Lamb Weston still outperformed those trends. 

The pricing drag is shrinking too. Price/mix improved from negative 2.4% in Q4 to negative 1.7% in Q1, a 70-basis-point sequential improvement. About 70% of contracts up for renewal this year have already been completed, with high retention and pricing reflecting the inflationary environment. 
lamb weston - StockEarnings

That is a much healthier setup than the stock’s recent price action suggests. Lamb Weston doesn’t need restaurant traffic to explode. It needs its existing volume gains to keep showing up while the pricing hole gets smaller.

Europe Is The Problem That Could Become An Advantage

Europe is still ugly. International sales fell 8%, with volume down 6% and price/mix down 2%. International adjusted EBITDA dropped to $27 million, reflecting lower European volume and higher carry-in potato costs. Then the supply picture gets complicated.

Lamb Weston says prolonged heat and dry conditions in Europe produced a smaller potato crop, with tonnage tracking well below historical averages. The company expects tighter supply to raise raw-material costs and is already working with customers to modify product specifications. Normally, higher potato costs would be another reason to stay away from LW.

This time, there is another side to the equation. Management says industry capacity is rationalizing, expansion projects are being delayed or shut down, and supply and demand are beginning to move back toward balance. Lamb Weston has also stopped production at its Broekhuizenvorst facility and shifted customers to other locations to improve network utilization.

The company is therefore entering a tighter supply environment with a cost structure it has already been attacking for more than a year. That can matter enormously once volume gains stop being swallowed by excess capacity and weaker pricing.

The Guidance Requires Less Than You Think

Lamb Weston raised fiscal 2027 guidance despite the international weakness. Management now expects low-single-digit net-sales growth, $1.125 billion to $1.215 billion of adjusted EBITDA, $3.05 to $3.35 of adjusted EPS, $730 million to $810 million of adjusted operating income and $750 million to $800 million of operating cash flow. The previous EPS range was $2.95 to $3.25, while the comparable FY2026 adjusted EPS was $2.90. 

The EBITDA math is particularly interesting as Q1 produced $286 million. The midpoint of the new full-year EBITDA range is $1.17 billion, leaving roughly $884 million for the final three quarters, or about $295 million per quarter.

That isn’t an outrageous hurdle at all. Management already expects Q2 adjusted EBITDA to rise in the high single digits to low double digits, with net sales up in the low single digits. Meanwhile, the company is running an enterprise-wide zero-based budgeting program, with adjusted SG&A essentially flat year over year after removing one-time items. Management says the cost program has permanently lowered its operating cost base.

Put another way, the ingredients for better earnings are starting to line up: volume is rising, price/mix is recovering, costs are being attacked, and industry capacity is coming out.

LW Has Started To Turn The Chart

The technical picture gives the fundamental story some teeth here. LW spent September sliding from the mid-$50s toward $40, where buyers repeatedly defended the stock. October 6 brought a sharp reversal: the shares closed at $47.91 after trading as high as $50.19, with volume surging to 8.38 million.

The stock has reclaimed its 20-day SMA at $45.57 and is now just above its 200-day SMA at $45.73. The 50-day SMA at $50.08 is the next obstacle. A clean move through 50–50.10 would take LW back above its intermediate trend and put the 54–55 September breakdown area back in play.

I like the setup. The North American business is already producing volume and EBITDA growth, while a tightening potato market and shrinking industry capacity could give those gains more earnings leverage than the current numbers show. If LW clears $50 with volume behind it, the market may finally start trading the earnings power that sits beyond this quarter’s headline results.
lamb weston - StockEarnings

Join over 1.2M+ investors/traders who receive daily and weekly notable earnings alerts with predicted move
