ajax loader

Loading...


Ride-the-Wave Strategy – Best for Stock Traders

Ride-the-Wave targets multi-day price momentum following a company’s earnings announcement (EA). With this strategy:

  1. Buy a stock one day post-EA if a stock reacts positively post-earnings:
    1. Near the close of trading the EA-day for a pre-market-EA
    2. Near the close of the following day for a post-market-EA
  2. Sell-to-close after 7-10 days, or possibly earlier if a desired price target is reached

Similarly,

  1. short a stock one day post-EA if a stock reacts negatively post-earnings:
    1. near the close of trading the EA-day for a premarket-EA
    2. near the close of the following day for a post-market-EA
  2. then buy-to-close after 7-10 days, or possibly earlier if a desired price target is reached

Important: Ride-the-Wave is predicated on significant price momentum triggered by an EA. The 7-10 day scenario is the maximum trade hold-time. If you see post EA-momentum is halted or reversed by a significant opposite move, re-evaluate your presence in the trade.

This popular StockEarnings screen below will give you a list of stocks that historically exhibit significant price momentum following an EA for the next seven days:

  1. Stocks exhibiting positive post-EA price moves are buy-candidates
  2. Stocks exhibiting negative post-EA price moves are sell/short-candidates

The screen includes those stocks whose Earnings just came out in last two days.

Screen criteria:

  1. Earnings Date Start Date : Current Date + -1 Day
  2. Earnings Date End Date : Current Date + -2 Days
  3. Predicted Move (Next Day) Max : 7%
  4. Predicted Move (On 7th Day) Min : 7%

Strategy Guideline:

  1. Buy the stock if stock has reacted positively. Short the stock if stock has reacted negatively (see above).
  2. Close the position in 7-10 days, or possibly earlier based on price move.

Volatility Crush Strategy - Best for Options Traders

The Volatility Crush strategy is used with stocks that typically experience relatively low-to-moderate price moves (≤4%) following their Earnings Announcements (EA). The basic trade idea is to sell put or call options right before the EA, collecting a credit when options premium is very high due to elevated implied volatility (IV). You then close the position right after the EA by buying the option back much cheaper due to the significant drop in IV that occurs after the mystery of the EA disappears. In assessing this trade, you need to do your homework to ensure you collect sufficient premium to make the trade worthwhile.

This trade is practical due to the low-to-moderate price-move after the EA, which generally won’t significantly affect the options price, unlike an “action” stock, which experience great price moves post-EA. With these symbols, if you’re on the right side of the price move, that’s a great thing. But if you’re on the wrong side of the move, not so great. Consequently, by minimizing the effect of the post-EA price move, you have a much better chance to profit from the reduction in IV without it being ruined by a violent price move.

For this trade, open the position either (1) the night before the EA when the company announces earnings or (2) during the EA day when it announces post-market, generally capturing IV at or close to its peak.

For this trade, open the position either (1) the night before the EA when the company announces earnings or (2) during the EA day when it announces post-market, generally capturing IV at or close to its peak.

This popular stockearnings screen will give you a list of stocks which do not react more than 4% fpost-EA. It includes only those stocks whose earnings are releasing next day.

Screen criteria:

  1. Earnings Date Start Date : Current Date + 1
  2. Earnings Date End Date : Current Date + 1
  3. Predicted Move (Next Day) Max : 4%
  4. Options Type: Weekly

Strategy Guideline:

  1. Options Strategy: Sell Call and Put
  2. Options Strike Price: Current Stock Price – (% Predicated Move x 2)
  3. Expiration Date: It should generally be the closest expiry immediately after the EA.
  4. Buy Insurance: Buying back Call and Put at Strike price which 10% lower than Sell Strike Price is optional but recommended.

Watch Video for More Detail

Volatility Rush Strategy - Best for Options Traders

The Volatility Rush takes advantage of increasing options premiums into earnings announcements (EA) caused by an anticipated rise in Implied Volatility (IV). With this strategy, Buy a Call and Put at-the-money (a long straddle) 2-3 weeks before the EA when IV is lower. Sell the position either (1) the night before the EA when the company announces earnings pre-market, or (2) during the EA day when it announces post-market, generally capturing IV at or close to its peak.

This popular screen will give you a list of stocks whose Options premiums tend to rise into Earnings. It includes only those stocks whose Earnings are at least two weeks away from today.

Screen criteria:

  1. Earnings Date Start Date : Current Date + 15 Days
  2. Earnings Date End Date : Current Date + 30 Days
  3. Predicted Move (Next Day) Min : 5%
  4. Options Type: Weekly or Monthly if that lines up with the two to three-week lead-time for entering the trade

Strategy Guideline:

  1. Buy a Straddle at or close to the money two to three weeks pre-EA.
  2. Sell the position either the night before the EA when the company announces earnings pre-market, or during the EA day when it announces post-market.
  3. Expiration date should generally be the closest expiry immediately after the EA.
  4. Straddle price should not be more 60% of predicted move.

Predicted Move (Volatility)

Similar to Implied Volatility in Options. Expected volatility % based on our Proprietary Volatility Predication Model. We are expecting that stock price will likely to reach % in either direction by the end of next trading session after Earnings are released and not necessarily the closing volatility %.

Why is it important?

    This indicator helps

  1. Knowing expected volatility in stocks after Earnings helps to decide trading stocks before Earnings Announcement.
  2. Taking Advantage of volatility collapse following Earnings Results by using Advance Options strategies such as Spread and Straddles.

Since Last Earnings

Change in share price since last Earnings release.

Why is it Important?

When share has gained more than 10% since it's last Earning release, it tends to over react to minor bad news and give up some gains if not all. So, it contains more downside volatility than upside When share has dropped more than 10% since it's last Earning release, it tends to over react to minor good news and recover some drops if not all. So, it contains more upside volatility than downside.

EPS Surprise (%)

Occurs when a company's reported quarterly or annual profits are above or below analysts' expectations. Here is the formula to derive % EPS Surprice:

Actual EPS - Estimated EPS
------------------------------------- x 100
Estimated EPS

Why is it Important?

Earnings surprises can have a huge impact on a company's stock price. Several studies suggest that positive earnings surprises not only lead to an immediate hike in a stock's price, but also to a gradual increase over time. Hence, it's not surprising that some companies are known for routinely beating earning projections. A negative earnings surprise will usually result in a decline in share price.

Next Day Price Change (%)

Next Regular trading session Closing price following Earnings result.

For After Market Close Earnings, It is a next trading day closing price. For Before Market Open Earnings, It is the same trading day closing price.

Why is it Important?

Next Day price change is a reaction of Earnings result.

Levi Strauss Earnings: The Tariff Windfall Is Hiding A Better Margin Story

Posted on Oct 08, 2026 by Grayson Cavern

Levi Strauss Earnings: The Tariff Windfall Is Hiding A Better Margin Story

Levi Strauss & Co. (NYSE: LEVI) delivered $0.48 in adjusted earnings per share (EPS) for Q3, up 41% year over year, on $1.61 billion in revenue, up 4%, with organic revenue rising 5%. Then the stock dropped almost 5% to $19.51. At first glance, the selloff looks justified: Levi received $79 million in IEEPA tariff refunds through cost of goods sold and another $5 million in interest income, with the refund contributing a net $0.11 to adjusted EPS after the company redeployed part of the benefit back into the business. 

But there is a much better way to trade the quarter than simply subtracting $0.11 from EPS and calling it a day.

Adjusted EBIT climbed 36% to $249 million, pushing adjusted EBIT margin to 15.5% from 11.8%. Yes, the tariff refund contributed 490 basis points of margin expansion, but Levi spent roughly 160 basis points of that benefit supporting the business, leaving a 330-basis-point net benefit. Gross margin expanded 450 basis points to 66.2%, with the net tariff contribution accounting for 370 basis points. The underlying gross-margin improvement was therefore about 80 basis points. 

Sure enough, the refund inflated the quarter. But it did not manufacture every bit of the improvement underneath it.

The Weak Spot Is Still DTC


Levi’s direct-to-consumer business remains the part of the chart I wouldn’t ignore. DTC revenue rose only 2% in Q3, comparable sales increased 0.4%, U.S. DTC revenue declined 1%, and Europe DTC fell 2%. With DTC accounting for 45% of total revenue, a sluggish consumer channel can still put a lid on the stock. 

The rest of the portfolio is carrying more weight as wholesale revenue increased 6% on both a reported and organic basis, with every segment contributing and Europe and Asia particularly strong. Europe organic revenue increased 5%, Asia jumped 10%, and Beyond Yoga grew 9%. The Levi’s brand itself delivered 4% organic growth, while Levi Strauss Signature increased 12.6%. 

That leaves LEVI with a peculiar earnings setup. The channel most visible to the consumer is dragging, while the wholesale machine is gaining traction across multiple geographies. Through nine months, organic revenue was up 6.5%, wholesale organic revenue had increased 6.3%, and adjusted EBIT had risen 20% to $608 million. 

Management also says recent DTC trends have accelerated enough to support mid-single-digit DTC growth in Q4, including in the U.S. That is the number bothering me for the next quarter. If DTC finally starts contributing alongside the wholesale and international businesses, Levi’s earnings growth gets a much cleaner runway.

The Guidance Is Doing More Work Than The Refund

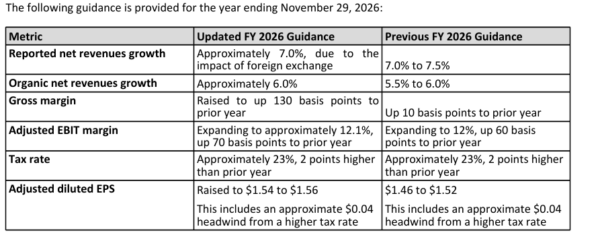
Levi raised its full-year outlook after Q3. Organic revenue growth is now expected at approximately 6%, compared with the previous 5.5%-6% range. Adjusted EBIT margin is projected at approximately 12.1%, up 70 basis points from the prior year and above the previous 12% forecast. Adjusted diluted EPS moved from 1.46-1.52 to 1.54-1.56.

Management expects to redeploy roughly $60 million of tariff refunds during the full year, including approximately $35 million in Q4, assuming current tariff rates remain in place. That money is going toward areas such as marketing and promotions rather than simply dropping straight to the bottom line. Levi is also initiating another $100 million accelerated share repurchase after completing its previous $200 million ASR, which retired about 9.4 million shares across the program. 

So yes, the tariff refund will disappear from the model eventually. The higher revenue base, the wholesale growth, the international momentum, the cost structure, and the shares retired through buybacks won’t disappear with it.

Levi’s own forecast does carry some baggage. The company assumes no significant worsening in consumer pressure, inflation, supply-chain disruptions, tariffs or currency fluctuations. Management also openly acknowledged that Q3 DTC performance fell short of internal expectations. For the bulls, Q4 DTC is the next checkpoint.
levi - StockEarnings
Source: Levi Strauss

On A Technical Fault Line

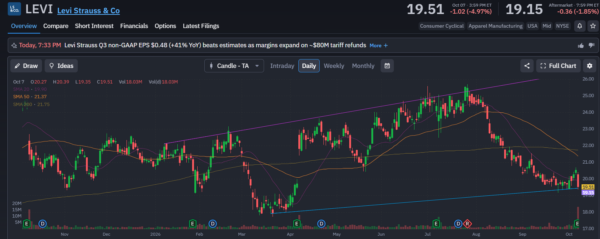
The earnings reaction has put the stock in an awkward spot. LEVI closed at $19.51, below its 20-day SMA at roughly $19.90 and well below the 50-day and 200-day averages around $21.37 and $21.75. The stock had already rolled over from roughly $25.50 in late July, and Wednesday’s 4.97% drop pushed it back toward the rising trendline that has been connecting the spring lows.

That trendline is now sitting around the $19.50 area, almost exactly where the stock closed. For traders, the levels are pretty straightforward. Lose that trendline decisively and the March-to-October recovery structure takes a hit. Reclaim $19.90 first, then $21.37, and the tape starts looking less like a failed breakout and more like an earnings-driven shakeout. Above the 200-day around $21.75, LEVI would have a much better shot at challenging the 23–25 region where sellers took control during the summer.

I wouldn’t chase the stock simply because adjusted EPS beat. The better trade is tied to what happens next with the underlying earnings power.

At $19.51, the stock sits directly on a technical support line, while the business posts stronger organic growth and margins beneath a quarter distorted by tariffs. If U.S. DTC finally joins the wholesale and international businesses, the next leg in LEVI’s earnings story could have considerably less to do with tariff refunds and more to do with the brand itself.
levi - StockEarnings

Join over 1.2M+ investors/traders who receive daily and weekly notable earnings alerts with predicted move
