ajax loader

Loading...


Ride-the-Wave Strategy – Best for Stock Traders

Ride-the-Wave targets multi-day price momentum following a company’s earnings announcement (EA). With this strategy:

  1. Buy a stock one day post-EA if a stock reacts positively post-earnings:
    1. Near the close of trading the EA-day for a pre-market-EA
    2. Near the close of the following day for a post-market-EA
  2. Sell-to-close after 7-10 days, or possibly earlier if a desired price target is reached

Similarly,

  1. short a stock one day post-EA if a stock reacts negatively post-earnings:
    1. near the close of trading the EA-day for a premarket-EA
    2. near the close of the following day for a post-market-EA
  2. then buy-to-close after 7-10 days, or possibly earlier if a desired price target is reached

Important: Ride-the-Wave is predicated on significant price momentum triggered by an EA. The 7-10 day scenario is the maximum trade hold-time. If you see post EA-momentum is halted or reversed by a significant opposite move, re-evaluate your presence in the trade.

This popular StockEarnings screen below will give you a list of stocks that historically exhibit significant price momentum following an EA for the next seven days:

  1. Stocks exhibiting positive post-EA price moves are buy-candidates
  2. Stocks exhibiting negative post-EA price moves are sell/short-candidates

The screen includes those stocks whose Earnings just came out in last two days.

Screen criteria:

  1. Earnings Date Start Date : Current Date + -1 Day
  2. Earnings Date End Date : Current Date + -2 Days
  3. Predicted Move (Next Day) Max : 7%
  4. Predicted Move (On 7th Day) Min : 7%

Strategy Guideline:

  1. Buy the stock if stock has reacted positively. Short the stock if stock has reacted negatively (see above).
  2. Close the position in 7-10 days, or possibly earlier based on price move.

Volatility Crush Strategy - Best for Options Traders

The Volatility Crush strategy is used with stocks that typically experience relatively low-to-moderate price moves (≤4%) following their Earnings Announcements (EA). The basic trade idea is to sell put or call options right before the EA, collecting a credit when options premium is very high due to elevated implied volatility (IV). You then close the position right after the EA by buying the option back much cheaper due to the significant drop in IV that occurs after the mystery of the EA disappears. In assessing this trade, you need to do your homework to ensure you collect sufficient premium to make the trade worthwhile.

This trade is practical due to the low-to-moderate price-move after the EA, which generally won’t significantly affect the options price, unlike an “action” stock, which experience great price moves post-EA. With these symbols, if you’re on the right side of the price move, that’s a great thing. But if you’re on the wrong side of the move, not so great. Consequently, by minimizing the effect of the post-EA price move, you have a much better chance to profit from the reduction in IV without it being ruined by a violent price move.

For this trade, open the position either (1) the night before the EA when the company announces earnings or (2) during the EA day when it announces post-market, generally capturing IV at or close to its peak.

For this trade, open the position either (1) the night before the EA when the company announces earnings or (2) during the EA day when it announces post-market, generally capturing IV at or close to its peak.

This popular stockearnings screen will give you a list of stocks which do not react more than 4% fpost-EA. It includes only those stocks whose earnings are releasing next day.

Screen criteria:

  1. Earnings Date Start Date : Current Date + 1
  2. Earnings Date End Date : Current Date + 1
  3. Predicted Move (Next Day) Max : 4%
  4. Options Type: Weekly

Strategy Guideline:

  1. Options Strategy: Sell Call and Put
  2. Options Strike Price: Current Stock Price – (% Predicated Move x 2)
  3. Expiration Date: It should generally be the closest expiry immediately after the EA.
  4. Buy Insurance: Buying back Call and Put at Strike price which 10% lower than Sell Strike Price is optional but recommended.

Watch Video for More Detail

Volatility Rush Strategy - Best for Options Traders

The Volatility Rush takes advantage of increasing options premiums into earnings announcements (EA) caused by an anticipated rise in Implied Volatility (IV). With this strategy, Buy a Call and Put at-the-money (a long straddle) 2-3 weeks before the EA when IV is lower. Sell the position either (1) the night before the EA when the company announces earnings pre-market, or (2) during the EA day when it announces post-market, generally capturing IV at or close to its peak.

This popular screen will give you a list of stocks whose Options premiums tend to rise into Earnings. It includes only those stocks whose Earnings are at least two weeks away from today.

Screen criteria:

  1. Earnings Date Start Date : Current Date + 15 Days
  2. Earnings Date End Date : Current Date + 30 Days
  3. Predicted Move (Next Day) Min : 5%
  4. Options Type: Weekly or Monthly if that lines up with the two to three-week lead-time for entering the trade

Strategy Guideline:

  1. Buy a Straddle at or close to the money two to three weeks pre-EA.
  2. Sell the position either the night before the EA when the company announces earnings pre-market, or during the EA day when it announces post-market.
  3. Expiration date should generally be the closest expiry immediately after the EA.
  4. Straddle price should not be more 60% of predicted move.

Predicted Move (Volatility)

Similar to Implied Volatility in Options. Expected volatility % based on our Proprietary Volatility Predication Model. We are expecting that stock price will likely to reach % in either direction by the end of next trading session after Earnings are released and not necessarily the closing volatility %.

Why is it important?

    This indicator helps

  1. Knowing expected volatility in stocks after Earnings helps to decide trading stocks before Earnings Announcement.
  2. Taking Advantage of volatility collapse following Earnings Results by using Advance Options strategies such as Spread and Straddles.

Since Last Earnings

Change in share price since last Earnings release.

Why is it Important?

When share has gained more than 10% since it's last Earning release, it tends to over react to minor bad news and give up some gains if not all. So, it contains more downside volatility than upside When share has dropped more than 10% since it's last Earning release, it tends to over react to minor good news and recover some drops if not all. So, it contains more upside volatility than downside.

EPS Surprise (%)

Occurs when a company's reported quarterly or annual profits are above or below analysts' expectations. Here is the formula to derive % EPS Surprice:

Actual EPS - Estimated EPS
------------------------------------- x 100
Estimated EPS

Why is it Important?

Earnings surprises can have a huge impact on a company's stock price. Several studies suggest that positive earnings surprises not only lead to an immediate hike in a stock's price, but also to a gradual increase over time. Hence, it's not surprising that some companies are known for routinely beating earning projections. A negative earnings surprise will usually result in a decline in share price.

Next Day Price Change (%)

Next Regular trading session Closing price following Earnings result.

For After Market Close Earnings, It is a next trading day closing price. For Before Market Open Earnings, It is the same trading day closing price.

Why is it Important?

Next Day price change is a reaction of Earnings result.

Applied Digital Earnings Show Its AI Inflection and 322% Explosive Growth

Posted on Oct 08, 2026 by Grayson Cavern

Applied Digital Earnings Show Its AI Inflection and 322% Explosive Growth

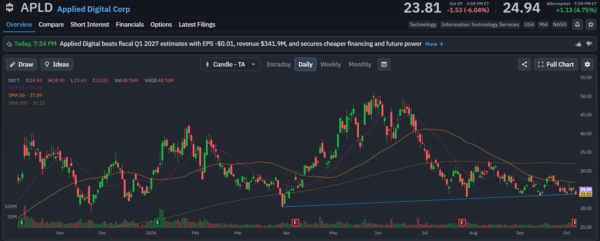
Applied Digital (NASDAQ: APLD) went from building data centers for crypto miners to signing multibillion-dollar AI infrastructure contracts in roughly a year. The stock, meanwhile, has gone from nearly $50 in June to $23.81.

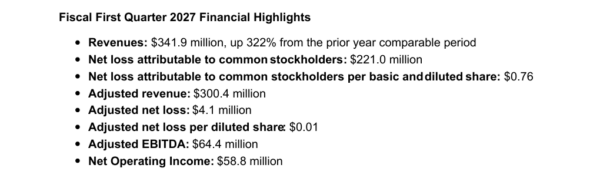
Then came its latest fiscal Q1 2027 earnings report, where revenue jumped 322% to $341.9 million, while adjusted EBITDA surged from $0.5 million to $64.4 million. Now those numbers are starting to put some operating weight behind the AI infrastructure story. Applied Digital now has approximately 1.41 GW of critical IT load under lease, representing roughly $36 billion of contracted revenue over the initial lease terms. 

The earnings also exposed the enormous capital burden sitting underneath that growth. That tension is what makes APLD worth looking at here.

The AI Buildout Is Now Showing Up in the Income Statement


The headline growth was huge, but the composition of the quarter is what makes it more useful.  HPC Hosting generated $262.6 million of revenue, including $65.8 million of base rent and $183.5 million from tenant fit-out services, producing $33.4 million of segment operating profit. 

Base-rental revenue is particularly important because it represents the recurring economics of the infrastructure once customers are actually occupying it. The business generated $58.8 million of NOI, giving the operating campuses an 89% NOI margin. 

The broader financial picture moved sharply as well. Adjusted revenue excluding ChronoScale reached $300.4 million versus $64.2 million a year earlier, while adjusted net loss narrowed to just $4.1 million from $7.6 million. 

For a company still building billions of dollars of infrastructure, going from essentially zero adjusted EBITDA to $64.4 million in one year is the number I care about most.
applied digital - StockEarnings
Source: Applied Digital

Building AI Factories Is Expensive as Hell

There is another side to those numbers, and the balance sheet makes it impossible to ignore. Applied Digital reported a $221 million net loss from continuing operations, compared with an $18.5 million loss a year earlier. Interest expense jumped 866% to $77.4 million, while SG&A climbed 289% to $114.7 million. 

The company also spent roughly $2.07 billion on property and equipment during the quarter, while generating just $63.9 million of operating cash flow. As of August 31, it held $3.7 billion in cash, cash equivalents, and restricted cash against $6.4 billion of debt. 

That is the tradeoff investors are making with Applied Digital. The company can produce extraordinary revenue growth when new AI capacity comes online, but getting that capacity online requires an extraordinary amount of capital first.

And management is still funding the pipeline aggressively. Applied Digital closed a $1.59 billion senior secured notes offering to fund construction of the 150 MW third HPC building at Polaris Forge 1 and repay a $300 million bridge facility. So the earnings don’t eliminate the financing risk. They show why the company keeps taking it.

1.41 GW Is Where the Earnings Story Gets Bigger

The reason investors can tolerate that capital intensity is the contracted backlog sitting behind it. The company has leases covering approximately 1.41 GW across five campuses, with roughly $36 billion of contracted revenue during the initial lease terms and approximately $86 billion if renewal options are exercised. 

And the physical buildout is advancing. Polaris Forge 1 reached 250 MW of live capacity after its second 75 MW phase became operational on October 1. Management expects Polaris Forge 2 to bring delivered critical IT load across its North Dakota campuses to 300 MW by year-end 2026. 

That progression is important because APLD is gradually moving from signing leases to collecting the economics attached to those leases. The first 100 MW building at Polaris Forge 1 became operational in October 2025. Building 2 added another 150 MW in two phases, while the third 150 MW building and several other campuses remain under construction. 

If APLD can keep converting that contracted capacity into operating campuses without blowing out construction costs or its financing requirements, the earnings base could look dramatically different over the next several years.

APLD Has Already Taken the Beating

The stock doesn’t look like it’s pricing that future in with much enthusiasm. Post-earnings, APLD closed at $23.81, with the 20-day SMA at $25.70, the 50-day at $27.09, and the 200-day at $32.13. The shares are down heavily from their roughly $50 peak in June, but they are now sitting near the rising support trendline that has developed from the April lows.

That creates a weird technical setup. The fundamentals are expanding while the stock remains below all three major moving averages. A reclaim of the $25.70 20-day SMA, followed by the $27.09 50-day, would begin repairing the tape. Above that, the 200-day around $32.13 becomes the larger technical hurdle. Lose the current $23-$24 support zone, however, and the market would be signaling that investors are still more concerned about APLD’s capital requirements than its contracted AI infrastructure.
applied digital - StockEarnings

Here’s Why APLD Is Still a Buy

This quarter showed that the AI buildout is no longer just a collection of leases and construction projects sitting on a presentation slide. Revenue is scaling, EBITDA is appearing, operating campuses are expanding, and 1.41 GW of contracted capacity gives the company a substantial runway. That makes Applied Digital a buy for me.


Join over 1.2M+ investors/traders who receive daily and weekly notable earnings alerts with predicted move