ajax loader

Loading...


Ride-the-Wave Strategy – Best for Stock Traders

Ride-the-Wave targets multi-day price momentum following a company’s earnings announcement (EA). With this strategy:

  1. Buy a stock one day post-EA if a stock reacts positively post-earnings:
    1. Near the close of trading the EA-day for a pre-market-EA
    2. Near the close of the following day for a post-market-EA
  2. Sell-to-close after 7-10 days, or possibly earlier if a desired price target is reached

Similarly,

  1. short a stock one day post-EA if a stock reacts negatively post-earnings:
    1. near the close of trading the EA-day for a premarket-EA
    2. near the close of the following day for a post-market-EA
  2. then buy-to-close after 7-10 days, or possibly earlier if a desired price target is reached

Important: Ride-the-Wave is predicated on significant price momentum triggered by an EA. The 7-10 day scenario is the maximum trade hold-time. If you see post EA-momentum is halted or reversed by a significant opposite move, re-evaluate your presence in the trade.

This popular StockEarnings screen below will give you a list of stocks that historically exhibit significant price momentum following an EA for the next seven days:

  1. Stocks exhibiting positive post-EA price moves are buy-candidates
  2. Stocks exhibiting negative post-EA price moves are sell/short-candidates

The screen includes those stocks whose Earnings just came out in last two days.

Screen criteria:

  1. Earnings Date Start Date : Current Date + -1 Day
  2. Earnings Date End Date : Current Date + -2 Days
  3. Predicted Move (Next Day) Max : 7%
  4. Predicted Move (On 7th Day) Min : 7%

Strategy Guideline:

  1. Buy the stock if stock has reacted positively. Short the stock if stock has reacted negatively (see above).
  2. Close the position in 7-10 days, or possibly earlier based on price move.

Volatility Crush Strategy - Best for Options Traders

The Volatility Crush strategy is used with stocks that typically experience relatively low-to-moderate price moves (≤4%) following their Earnings Announcements (EA). The basic trade idea is to sell put or call options right before the EA, collecting a credit when options premium is very high due to elevated implied volatility (IV). You then close the position right after the EA by buying the option back much cheaper due to the significant drop in IV that occurs after the mystery of the EA disappears. In assessing this trade, you need to do your homework to ensure you collect sufficient premium to make the trade worthwhile.

This trade is practical due to the low-to-moderate price-move after the EA, which generally won’t significantly affect the options price, unlike an “action” stock, which experience great price moves post-EA. With these symbols, if you’re on the right side of the price move, that’s a great thing. But if you’re on the wrong side of the move, not so great. Consequently, by minimizing the effect of the post-EA price move, you have a much better chance to profit from the reduction in IV without it being ruined by a violent price move.

For this trade, open the position either (1) the night before the EA when the company announces earnings or (2) during the EA day when it announces post-market, generally capturing IV at or close to its peak.

For this trade, open the position either (1) the night before the EA when the company announces earnings or (2) during the EA day when it announces post-market, generally capturing IV at or close to its peak.

This popular stockearnings screen will give you a list of stocks which do not react more than 4% fpost-EA. It includes only those stocks whose earnings are releasing next day.

Screen criteria:

  1. Earnings Date Start Date : Current Date + 1
  2. Earnings Date End Date : Current Date + 1
  3. Predicted Move (Next Day) Max : 4%
  4. Options Type: Weekly

Strategy Guideline:

  1. Options Strategy: Sell Call and Put
  2. Options Strike Price: Current Stock Price – (% Predicated Move x 2)
  3. Expiration Date: It should generally be the closest expiry immediately after the EA.
  4. Buy Insurance: Buying back Call and Put at Strike price which 10% lower than Sell Strike Price is optional but recommended.

Watch Video for More Detail

Volatility Rush Strategy - Best for Options Traders

The Volatility Rush takes advantage of increasing options premiums into earnings announcements (EA) caused by an anticipated rise in Implied Volatility (IV). With this strategy, Buy a Call and Put at-the-money (a long straddle) 2-3 weeks before the EA when IV is lower. Sell the position either (1) the night before the EA when the company announces earnings pre-market, or (2) during the EA day when it announces post-market, generally capturing IV at or close to its peak.

This popular screen will give you a list of stocks whose Options premiums tend to rise into Earnings. It includes only those stocks whose Earnings are at least two weeks away from today.

Screen criteria:

  1. Earnings Date Start Date : Current Date + 15 Days
  2. Earnings Date End Date : Current Date + 30 Days
  3. Predicted Move (Next Day) Min : 5%
  4. Options Type: Weekly or Monthly if that lines up with the two to three-week lead-time for entering the trade

Strategy Guideline:

  1. Buy a Straddle at or close to the money two to three weeks pre-EA.
  2. Sell the position either the night before the EA when the company announces earnings pre-market, or during the EA day when it announces post-market.
  3. Expiration date should generally be the closest expiry immediately after the EA.
  4. Straddle price should not be more 60% of predicted move.

Predicted Move (Volatility)

Similar to Implied Volatility in Options. Expected volatility % based on our Proprietary Volatility Predication Model. We are expecting that stock price will likely to reach % in either direction by the end of next trading session after Earnings are released and not necessarily the closing volatility %.

Why is it important?

    This indicator helps

  1. Knowing expected volatility in stocks after Earnings helps to decide trading stocks before Earnings Announcement.
  2. Taking Advantage of volatility collapse following Earnings Results by using Advance Options strategies such as Spread and Straddles.

Since Last Earnings

Change in share price since last Earnings release.

Why is it Important?

When share has gained more than 10% since it's last Earning release, it tends to over react to minor bad news and give up some gains if not all. So, it contains more downside volatility than upside When share has dropped more than 10% since it's last Earning release, it tends to over react to minor good news and recover some drops if not all. So, it contains more upside volatility than downside.

EPS Surprise (%)

Occurs when a company's reported quarterly or annual profits are above or below analysts' expectations. Here is the formula to derive % EPS Surprice:

Actual EPS - Estimated EPS
------------------------------------- x 100
Estimated EPS

Why is it Important?

Earnings surprises can have a huge impact on a company's stock price. Several studies suggest that positive earnings surprises not only lead to an immediate hike in a stock's price, but also to a gradual increase over time. Hence, it's not surprising that some companies are known for routinely beating earning projections. A negative earnings surprise will usually result in a decline in share price.

Next Day Price Change (%)

Next Regular trading session Closing price following Earnings result.

For After Market Close Earnings, It is a next trading day closing price. For Before Market Open Earnings, It is the same trading day closing price.

Why is it Important?

Next Day price change is a reaction of Earnings result.

Costco Sales Jump 13%, but Expectations Are the Real Story

Posted on Oct 09, 2026 by Chris Markoch

Costco Sales Jump 13%, but Expectations Are the Real Story

Costco Wholesale Corp. (NASDAQ: COST) delivered another strong month. The warehouse club said September net sales rose 13% to $30.02 billion. That’s up from $26.58 billion in the same five-week period last year.

Comparable sales, excluding gasoline and currency effects, grew about 7.5% companywide. U.S. comparable sales rose 12.5%, or 8% on an adjusted basis. Digitally enabled sales jumped 19%.

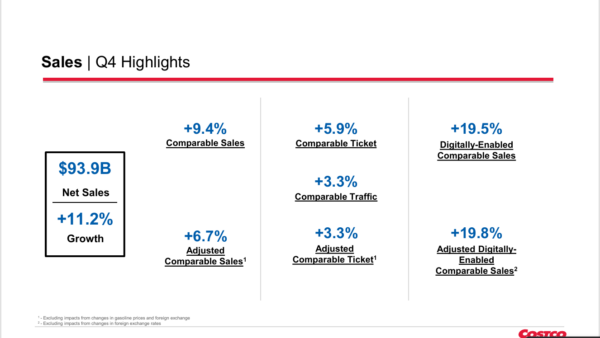
The pattern looks familiar. On September 24, Costco reported fiscal fourth-quarter 2026 results. Quarterly sales climbed 11%, and full-year sales topped $297 billion. Higher gasoline prices helped then, and they helped again in September.
costco - StockEarnings

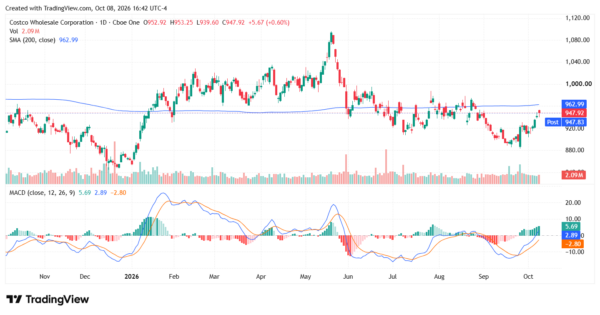
None of this is bad news. Yet COST stock closed at $947.92 on October 8. That’s still below its 200-day moving average near $963. It’s also about 14% under its May high of roughly $1,097.

So why isn’t a 13% sales gain doing more for the stock? The answer comes down to valuation and expectations. Costco has always been expensive. The question now is whether investors still believe its growth justifies the price.

Gas Is Doing the Heavy Lifting, but the Core Is Healthy


Gasoline was the biggest swing factor. Gas price inflation added about 3.8 percentage points to companywide comparable sales. The average selling price per gallon rose 32.8% from a year ago.

That flatters the headline number. But it doesn’t erase what’s underneath. Shopping frequency rose 4.7% worldwide and 4.3% in the U.S. The average transaction grew 2.8% with gas and currency stripped out.

In other words, more members are showing up, and they’re spending a bit more per trip. Nonfood sales grew by a high-single-digit percentage, led by gift cards, housewares and sporting goods. Fresh food rose by a mid- to high-single-digit percentage.

There is one caveat. A Labor Day timing shift added slightly more than half a point to September comps. October won’t have that tailwind.

Expensive, but Not by Costco’s Standards

The bigger concern for investors is valuation. COST trades at a forward price-to-earnings (P/E) ratio of around 41x. That’s the kind of multiple usually reserved for technology stocks.

But that comparison is a bit misleading. Costco’s current multiple sits about 10% below its own historical average. The stock is expensive relative to the broader market and to the retail sector. It isn’t expensive relative to itself.

Investors have always paid a premium for Costco. They pay for consistency, a loyal membership base, and a model that rarely disappoints. That premium hasn’t disappeared. It has simply shrunk.

What’s Changed Is Expectations

So what’s behind the smaller premium? In my view, it’s expectations. Investors appear to be pricing in slower growth.

Costco shoppers sit firmly on the upper leg of the K-shaped economy. Higher-income households have kept spending while others pull back. On paper, that’s a tailwind for Costco.

But there’s a wrinkle. Walmart (NASDAQ: WMT) and Dollar General (NYSE: DG) have both reported more traffic from higher-income shoppers, including for discretionary purchases. That’s spending that could otherwise land in a Costco cart.

To be clear, there’s no sign of that shift in Costco’s recent results. Member visits are still rising. But investors don’t want to be caught in a “gradually, then suddenly” trade. At 41x forward earnings, even a hint of share loss can matter.

Tariffs and the Membership Cushion

Costco is also stuck in the middle of trade policy. Tariff talks in Washington show no sign of resolving anytime soon. That leaves Costco managing cost uncertainty on imported goods. And a brand built on low prices has limited room to raise them.

The membership model softens much of this risk. Members pay an annual fee before they buy anything. Once that fee is paid, they have every reason to keep shopping there. That creates a floor under traffic that most retailers don’t have.

Costco investors know this. It’s a big reason the stock rarely trades at a discount, even in uncertain markets.

Analysts Are Bullish, but Not Chasing

Wall Street remains generally positive on COST. The consensus rating is a Moderate Buy. The average price target sits near $1,058, a little more than 10% above the October 8 close.

That’s a modest gap for a stock analysts like. And they don’t seem eager to push targets much higher. The current macro backdrop likely means interest rates stay elevated. It also leaves Costco with very little pricing flexibility. Neither condition argues for a richer multiple.

The chart tells a similar story. COST bounced from a late-September low near $885, and the MACD has crossed above its signal line. But the stock is now pressing against its 200-day moving average around $963. That line has capped most rallies since June. A decisive close above it would be a meaningful technical win.
costco - StockEarnings

The Wildcard: A Stock Split

One possible catalyst is a stock split. Management hasn’t signaled any plans for one. But that calculus could change if the holiday season disappoints.

There are plenty of ways that could happen. An escalation with Iran, a lame-duck Congress, or broader pressure on equities could all weigh on spending and sentiment.

Costco has split its stock several times, but not since a 2-for-1 split in January 2000. That’s more than 25 years. A split wouldn’t change the company’s value. But it would lower the price of a single share. For retail investors, that works a lot like a price cut.

Is COST Stock a Buy After Strong September Sales?

Costco’s September numbers confirm the business is healthy. Gas is inflating the headline, but traffic and core spending are growing too.

The stock’s challenge isn’t the business. It’s how much investors are willing to pay for it. Until the growth outlook clears up, COST may stay range-bound near its consensus target. A strong holiday season, or a surprise split, could change that.


A former marketing copywriter turned freelance financial writer and market analyst. I have a passion for delivering insights to investors. I write regularly about stocks for StockEarnings and MarketBeat. Posts are not advice.

Join over 1.2M+ investors/traders who receive daily and weekly notable earnings alerts with predicted move