ajax loader

Loading...


Ride-the-Wave Strategy – Best for Stock Traders

Ride-the-Wave targets multi-day price momentum following a company’s earnings announcement (EA). With this strategy:

  1. Buy a stock one day post-EA if a stock reacts positively post-earnings:
    1. Near the close of trading the EA-day for a pre-market-EA
    2. Near the close of the following day for a post-market-EA
  2. Sell-to-close after 7-10 days, or possibly earlier if a desired price target is reached

Similarly,

  1. short a stock one day post-EA if a stock reacts negatively post-earnings:
    1. near the close of trading the EA-day for a premarket-EA
    2. near the close of the following day for a post-market-EA
  2. then buy-to-close after 7-10 days, or possibly earlier if a desired price target is reached

Important: Ride-the-Wave is predicated on significant price momentum triggered by an EA. The 7-10 day scenario is the maximum trade hold-time. If you see post EA-momentum is halted or reversed by a significant opposite move, re-evaluate your presence in the trade.

This popular StockEarnings screen below will give you a list of stocks that historically exhibit significant price momentum following an EA for the next seven days:

  1. Stocks exhibiting positive post-EA price moves are buy-candidates
  2. Stocks exhibiting negative post-EA price moves are sell/short-candidates

The screen includes those stocks whose Earnings just came out in last two days.

Screen criteria:

  1. Earnings Date Start Date : Current Date + -1 Day
  2. Earnings Date End Date : Current Date + -2 Days
  3. Predicted Move (Next Day) Max : 7%
  4. Predicted Move (On 7th Day) Min : 7%

Strategy Guideline:

  1. Buy the stock if stock has reacted positively. Short the stock if stock has reacted negatively (see above).
  2. Close the position in 7-10 days, or possibly earlier based on price move.

Volatility Crush Strategy - Best for Options Traders

The Volatility Crush strategy is used with stocks that typically experience relatively low-to-moderate price moves (≤4%) following their Earnings Announcements (EA). The basic trade idea is to sell put or call options right before the EA, collecting a credit when options premium is very high due to elevated implied volatility (IV). You then close the position right after the EA by buying the option back much cheaper due to the significant drop in IV that occurs after the mystery of the EA disappears. In assessing this trade, you need to do your homework to ensure you collect sufficient premium to make the trade worthwhile.

This trade is practical due to the low-to-moderate price-move after the EA, which generally won’t significantly affect the options price, unlike an “action” stock, which experience great price moves post-EA. With these symbols, if you’re on the right side of the price move, that’s a great thing. But if you’re on the wrong side of the move, not so great. Consequently, by minimizing the effect of the post-EA price move, you have a much better chance to profit from the reduction in IV without it being ruined by a violent price move.

For this trade, open the position either (1) the night before the EA when the company announces earnings or (2) during the EA day when it announces post-market, generally capturing IV at or close to its peak.

For this trade, open the position either (1) the night before the EA when the company announces earnings or (2) during the EA day when it announces post-market, generally capturing IV at or close to its peak.

This popular stockearnings screen will give you a list of stocks which do not react more than 4% fpost-EA. It includes only those stocks whose earnings are releasing next day.

Screen criteria:

  1. Earnings Date Start Date : Current Date + 1
  2. Earnings Date End Date : Current Date + 1
  3. Predicted Move (Next Day) Max : 4%
  4. Options Type: Weekly

Strategy Guideline:

  1. Options Strategy: Sell Call and Put
  2. Options Strike Price: Current Stock Price – (% Predicated Move x 2)
  3. Expiration Date: It should generally be the closest expiry immediately after the EA.
  4. Buy Insurance: Buying back Call and Put at Strike price which 10% lower than Sell Strike Price is optional but recommended.

Watch Video for More Detail

Volatility Rush Strategy - Best for Options Traders

The Volatility Rush takes advantage of increasing options premiums into earnings announcements (EA) caused by an anticipated rise in Implied Volatility (IV). With this strategy, Buy a Call and Put at-the-money (a long straddle) 2-3 weeks before the EA when IV is lower. Sell the position either (1) the night before the EA when the company announces earnings pre-market, or (2) during the EA day when it announces post-market, generally capturing IV at or close to its peak.

This popular screen will give you a list of stocks whose Options premiums tend to rise into Earnings. It includes only those stocks whose Earnings are at least two weeks away from today.

Screen criteria:

  1. Earnings Date Start Date : Current Date + 15 Days
  2. Earnings Date End Date : Current Date + 30 Days
  3. Predicted Move (Next Day) Min : 5%
  4. Options Type: Weekly or Monthly if that lines up with the two to three-week lead-time for entering the trade

Strategy Guideline:

  1. Buy a Straddle at or close to the money two to three weeks pre-EA.
  2. Sell the position either the night before the EA when the company announces earnings pre-market, or during the EA day when it announces post-market.
  3. Expiration date should generally be the closest expiry immediately after the EA.
  4. Straddle price should not be more 60% of predicted move.

Predicted Move (Volatility)

Similar to Implied Volatility in Options. Expected volatility % based on our Proprietary Volatility Predication Model. We are expecting that stock price will likely to reach % in either direction by the end of next trading session after Earnings are released and not necessarily the closing volatility %.

Why is it important?

    This indicator helps

  1. Knowing expected volatility in stocks after Earnings helps to decide trading stocks before Earnings Announcement.
  2. Taking Advantage of volatility collapse following Earnings Results by using Advance Options strategies such as Spread and Straddles.

Since Last Earnings

Change in share price since last Earnings release.

Why is it Important?

When share has gained more than 10% since it's last Earning release, it tends to over react to minor bad news and give up some gains if not all. So, it contains more downside volatility than upside When share has dropped more than 10% since it's last Earning release, it tends to over react to minor good news and recover some drops if not all. So, it contains more upside volatility than downside.

EPS Surprise (%)

Occurs when a company's reported quarterly or annual profits are above or below analysts' expectations. Here is the formula to derive % EPS Surprice:

Actual EPS - Estimated EPS
------------------------------------- x 100
Estimated EPS

Why is it Important?

Earnings surprises can have a huge impact on a company's stock price. Several studies suggest that positive earnings surprises not only lead to an immediate hike in a stock's price, but also to a gradual increase over time. Hence, it's not surprising that some companies are known for routinely beating earning projections. A negative earnings surprise will usually result in a decline in share price.

Next Day Price Change (%)

Next Regular trading session Closing price following Earnings result.

For After Market Close Earnings, It is a next trading day closing price. For Before Market Open Earnings, It is the same trading day closing price.

Why is it Important?

Next Day price change is a reaction of Earnings result.

Home Depot’s New CEO Has a $30 Billion Growth Strategy to Prove

Posted on Nov 17, 2026 by Grayson Cavern

Home Depot’s New CEO Has a $30 Billion Growth Strategy to Prove

Home Depot (NYSE: HD) has spent about $32 billion expanding into professional building materials distribution, assembling a business that reaches contractors and construction projects far beyond its traditional store network. That investment has changed the company’s growth opportunity, but its third-quarter earnings suggest the financial benefits are still developing.

Third-quarter fiscal 2026 revenue increased 4.9% to $43.40 billion, while adjusted EPS grew 3.2% to $3.86. Richard McPhail, the executive who helped oversee the acquisition strategy as CFO, is about to become CEO. His appointment puts the next phase of Home Depot’s expansion in the hands of someone who understands what the company has bought and what shareholders need to get back from it.

Revenue Is Growing Faster Than Its EPS


HD’s Q3 earnings offer an early indication that its expanded business is contributing to growth, even as the traditional home improvement market contends with cautious consumers and pressure on discretionary spending. Revenue increased from $41.35 billion to $43.40 billion, while comparable sales rose 2.2%. That comparable-sales increase matters because it shows the existing retail business is still contributing, rather than leaving the growth story entirely dependent on acquired revenue.

The composition of those sales also tells us where demand is coming from. Comparable transactions declined 0.5%, but the average ticket increased 3%, suggesting customers are spending more per visit even as slightly fewer transactions take place. That is enough to keep sales moving higher, although a sustained recovery in customer activity would provide a broader foundation for growth.

But the more critical detail is what happened after those sales came in. Gross profit increased 2.9% to $14.22 billion, while operating income advanced just 2.4% to $5.48 billion. Operating margin consequently narrowed to 12.6% from 12.9%. Adjusted EPS grew 3.2% to $3.86, compared with GAAP EPS of $3.72, which included $0.18 per share in acquired intangible amortization.

This is where the investment case becomes more demanding for me. Home Depot is growing revenue, but its operating profit is not keeping pace, suggesting the company has more work to do before its larger business can deliver stronger earnings leverage.

Home Depot’s $32 Billion Pro Expansion Opens A $1 Trillion Market

The acquisitions explain why Home Depot is willing to accept a longer period of integration before expecting the full financial payoff. HD Supply added approximately $8 billion in enterprise value in 2020, SRS Distribution followed at approximately $18.25 billion in 2024, and GMS added another $5.5 billion in 2025. Together, these transactions represent approximately $31.75 billion invested in building a much broader professional distribution operation.

The strategic value is in what the businesses can offer together. HD Supply strengthened Home Depot’s maintenance, repair, and operations distribution business, SRS added roofing, landscaping, and pool supplies, and GMS brought drywall, ceilings, and steel framing into the portfolio. Home Depot can now serve contractors across more product categories and project requirements, with a wider distribution footprint and more opportunities to become a supplier they rely on repeatedly.

The SRS acquisition alone was expected to expand Home Depot’s addressable market by approximately $50 billion, bringing its total addressable market to around $1 trillion. That figure illustrates the scale of the opportunity, but market size alone does not create shareholder value. The real advantage comes if Home Depot can use its expanded network to win a larger share of contractor spending, cross-sell products, and fulfill more orders efficiently.

Now, the company expects fiscal 2026 sales growth of approximately 4.5%, yet adjusted EPS growth is forecast at only 2%, with operating margin around 12.4%. The company has substantially increased the market it can serve, but the earnings contribution still has room to develop. That gap is what makes the CEO transition important.

Richard McPhail Must Make The Acquisitions Pay Off

McPhail is taking over a strategy he helped shape as CFO, with responsibility for capital allocation, corporate strategy, and business development placing him close to the decisions behind HD’s expansion. His appointment is pivotal to the company moving into a different phase of the acquisition cycle. The priority is shifting from adding distribution businesses and market access to making those businesses contribute more meaningfully to consolidated earnings.

That means investors should pay particular attention to operating margins and returns on invested capital over the coming quarters. A larger distribution network should create opportunities to improve fulfillment, deepen contractor relationships, and generate more sales from existing customers. If those advantages fail to translate into better profitability, the company risks carrying a much larger cost base without earning an adequate return on the capital committed to building it.

The good thing is, HD has the cash generation to support the strategy. Operating cash flow reached $15.50 billion in the first nine months of fiscal 2026, up from $12.98 billion a year earlier. After $2.68 billion in capital expenditures, free cash flow stood at approximately $12.82 billion. However, working-capital outflows declined sharply from $2.69 billion to $358 million, explaining part of the improvement. The cash generation is substantial, but McPhail’s more important task is ensuring the acquired businesses eventually contribute stronger recurring profits.

HD Stock Still Has A $360 Ceiling

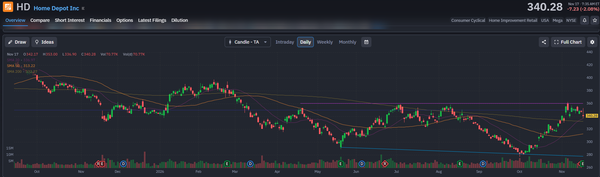
HD shares traded around $340.28 after retreating from the $350 to $360 resistance zone, following a sharp recovery from October’s lows. The stock remains above its 20-day moving average near $336.97, its 200-day average around $332.37 and its 50-day average near $313.22, leaving the broader recovery structure intact.

The $332 to $337 area now provides an important support cluster, while a decisive move above $360 on stronger volume would confirm that buyers are prepared to extend the recovery. A breakdown below that support zone would weaken the setup.

McPhail now has to turn Home Depot’s $32 billion expansion into stronger returns. That is the catalyst that could carry HD beyond its current resistance.
home depot - StockEarnings

Join over 1.2M+ investors/traders who receive daily and weekly notable earnings alerts with predicted move