ajax loader

Loading...


Ride-the-Wave Strategy – Best for Stock Traders

Ride-the-Wave targets multi-day price momentum following a company’s earnings announcement (EA). With this strategy:

  1. Buy a stock one day post-EA if a stock reacts positively post-earnings:
    1. Near the close of trading the EA-day for a pre-market-EA
    2. Near the close of the following day for a post-market-EA
  2. Sell-to-close after 7-10 days, or possibly earlier if a desired price target is reached

Similarly,

  1. short a stock one day post-EA if a stock reacts negatively post-earnings:
    1. near the close of trading the EA-day for a premarket-EA
    2. near the close of the following day for a post-market-EA
  2. then buy-to-close after 7-10 days, or possibly earlier if a desired price target is reached

Important: Ride-the-Wave is predicated on significant price momentum triggered by an EA. The 7-10 day scenario is the maximum trade hold-time. If you see post EA-momentum is halted or reversed by a significant opposite move, re-evaluate your presence in the trade.

This popular StockEarnings screen below will give you a list of stocks that historically exhibit significant price momentum following an EA for the next seven days:

  1. Stocks exhibiting positive post-EA price moves are buy-candidates
  2. Stocks exhibiting negative post-EA price moves are sell/short-candidates

The screen includes those stocks whose Earnings just came out in last two days.

Screen criteria:

  1. Earnings Date Start Date : Current Date + -1 Day
  2. Earnings Date End Date : Current Date + -2 Days
  3. Predicted Move (Next Day) Max : 7%
  4. Predicted Move (On 7th Day) Min : 7%

Strategy Guideline:

  1. Buy the stock if stock has reacted positively. Short the stock if stock has reacted negatively (see above).
  2. Close the position in 7-10 days, or possibly earlier based on price move.

Volatility Crush Strategy - Best for Options Traders

The Volatility Crush strategy is used with stocks that typically experience relatively low-to-moderate price moves (≤4%) following their Earnings Announcements (EA). The basic trade idea is to sell put or call options right before the EA, collecting a credit when options premium is very high due to elevated implied volatility (IV). You then close the position right after the EA by buying the option back much cheaper due to the significant drop in IV that occurs after the mystery of the EA disappears. In assessing this trade, you need to do your homework to ensure you collect sufficient premium to make the trade worthwhile.

This trade is practical due to the low-to-moderate price-move after the EA, which generally won’t significantly affect the options price, unlike an “action” stock, which experience great price moves post-EA. With these symbols, if you’re on the right side of the price move, that’s a great thing. But if you’re on the wrong side of the move, not so great. Consequently, by minimizing the effect of the post-EA price move, you have a much better chance to profit from the reduction in IV without it being ruined by a violent price move.

For this trade, open the position either (1) the night before the EA when the company announces earnings or (2) during the EA day when it announces post-market, generally capturing IV at or close to its peak.

For this trade, open the position either (1) the night before the EA when the company announces earnings or (2) during the EA day when it announces post-market, generally capturing IV at or close to its peak.

This popular stockearnings screen will give you a list of stocks which do not react more than 4% fpost-EA. It includes only those stocks whose earnings are releasing next day.

Screen criteria:

  1. Earnings Date Start Date : Current Date + 1
  2. Earnings Date End Date : Current Date + 1
  3. Predicted Move (Next Day) Max : 4%
  4. Options Type: Weekly

Strategy Guideline:

  1. Options Strategy: Sell Call and Put
  2. Options Strike Price: Current Stock Price – (% Predicated Move x 2)
  3. Expiration Date: It should generally be the closest expiry immediately after the EA.
  4. Buy Insurance: Buying back Call and Put at Strike price which 10% lower than Sell Strike Price is optional but recommended.

Watch Video for More Detail

Volatility Rush Strategy - Best for Options Traders

The Volatility Rush takes advantage of increasing options premiums into earnings announcements (EA) caused by an anticipated rise in Implied Volatility (IV). With this strategy, Buy a Call and Put at-the-money (a long straddle) 2-3 weeks before the EA when IV is lower. Sell the position either (1) the night before the EA when the company announces earnings pre-market, or (2) during the EA day when it announces post-market, generally capturing IV at or close to its peak.

This popular screen will give you a list of stocks whose Options premiums tend to rise into Earnings. It includes only those stocks whose Earnings are at least two weeks away from today.

Screen criteria:

  1. Earnings Date Start Date : Current Date + 15 Days
  2. Earnings Date End Date : Current Date + 30 Days
  3. Predicted Move (Next Day) Min : 5%
  4. Options Type: Weekly or Monthly if that lines up with the two to three-week lead-time for entering the trade

Strategy Guideline:

  1. Buy a Straddle at or close to the money two to three weeks pre-EA.
  2. Sell the position either the night before the EA when the company announces earnings pre-market, or during the EA day when it announces post-market.
  3. Expiration date should generally be the closest expiry immediately after the EA.
  4. Straddle price should not be more 60% of predicted move.

Predicted Move (Volatility)

Similar to Implied Volatility in Options. Expected volatility % based on our Proprietary Volatility Predication Model. We are expecting that stock price will likely to reach % in either direction by the end of next trading session after Earnings are released and not necessarily the closing volatility %.

Why is it important?

    This indicator helps

  1. Knowing expected volatility in stocks after Earnings helps to decide trading stocks before Earnings Announcement.
  2. Taking Advantage of volatility collapse following Earnings Results by using Advance Options strategies such as Spread and Straddles.

Since Last Earnings

Change in share price since last Earnings release.

Why is it Important?

When share has gained more than 10% since it's last Earning release, it tends to over react to minor bad news and give up some gains if not all. So, it contains more downside volatility than upside When share has dropped more than 10% since it's last Earning release, it tends to over react to minor good news and recover some drops if not all. So, it contains more upside volatility than downside.

EPS Surprise (%)

Occurs when a company's reported quarterly or annual profits are above or below analysts' expectations. Here is the formula to derive % EPS Surprice:

Actual EPS - Estimated EPS
------------------------------------- x 100
Estimated EPS

Why is it Important?

Earnings surprises can have a huge impact on a company's stock price. Several studies suggest that positive earnings surprises not only lead to an immediate hike in a stock's price, but also to a gradual increase over time. Hence, it's not surprising that some companies are known for routinely beating earning projections. A negative earnings surprise will usually result in a decline in share price.

Next Day Price Change (%)

Next Regular trading session Closing price following Earnings result.

For After Market Close Earnings, It is a next trading day closing price. For Before Market Open Earnings, It is the same trading day closing price.

Why is it Important?

Next Day price change is a reaction of Earnings result.

Oil Prices: Top Ways to Trade Fear of $150 Crude

Posted on Jun 10, 2026 by Ian Cooper

Oil Prices: Top Ways to Trade Fear of $150 Crude

With energy markets facing heightened geopolitical risk, investors are increasingly looking for ways to capitalize on rising oil prices. While major oil producers could benefit from a sustained rally, energy-focused exchange-traded funds (ETFs) may offer a diversified and cost-effective way to gain exposure to one of the market’s hottest sectors.

This morning, oil was up by $1.76 at $89.92, and could gush to $150 if the Iranian war doesn’t end soon, as noted by Claudio Galimberti, chief economist at Rystad Energy, as quoted by CNBC. “At this point, unless we solve [the Middle East conflict], unless we start to see an increase in the flow, then we are going to see lower and lower inventories, which means higher and higher prices,” Galimberti added.

Not helping, Exxon Mobil just warned that oil inventories will hit “really, really low levels” in coming weeks with the conflict. “We’re approaching unheard of inventory levels,” said Exxon Senior Vice President Neil Chapman. “I mean really, really low levels. You can debate whether that’s going to hit, those really low levels, in two weeks or three weeks. Once you get to that point, then you’ll see price shoot up.”

And, according to Trump on social media, “They’ve taken too long to negotiate a deal that would have been great for them, now they will have to pay the price.”

A $150 Oil Scenario Is No Longer Unthinkable


But at this point, it could easily happen with war intensifying again, and with reserves dropping to historically low levels. 

That being said, investors can always jump into oil stocks, such as Exxon Mobil (NYSE: XOM), Chevron (NYSE: CVX), and Occidental Petroleum (NYSE: OXY). However, if you want greater exposure at a lower cost, investors may want to consider exchange-traded funds, such as:

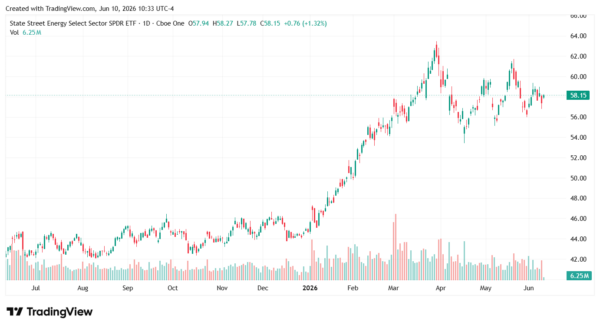
XLE Remains a Top Energy ETF to Watch

With an expense ratio of 0.08%, the SPDR Energy Select Sector ETF (NYSE: XLE) provides exposure to companies in the oil, gas, and consumable fuel, energy equipment, and services industries, as noted by State Street SPDR. From its current price of $57.39, we’d like to see it rally back to $62 initially, with the war showing signs of intensifying again. 

oil prices-StockEarnings

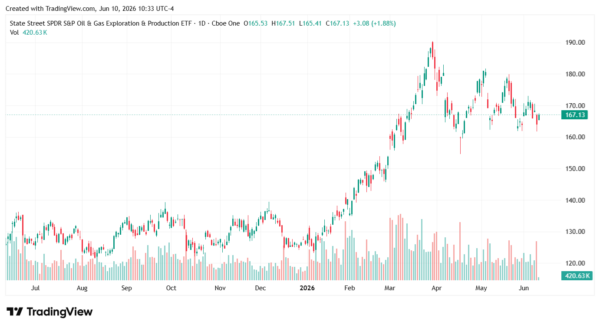
Higher Crude Prices Could Lift XOP

With an expense ratio of 0.35%, the SPDR S&P Oil & Gas Exploration & Production ETF (NYSE: XOP) provides exposure 51 oil and gas exploration and production segment of the S&P TMI, which comprises the following sub-industries: Integrated Oil & Gas, Oil & Gas Exploration & Production, and Oil & Gas Refining & Marketing, as noted by State Street SPDR.  From its current price of $164.05, we’d like to see the XOP ETF retest $190.

oil prices-StockEarnings

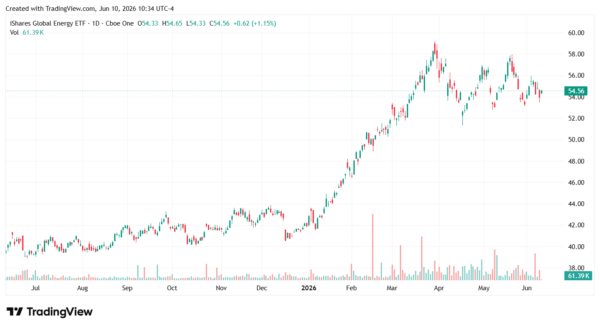
IXC Provides Global Energy Exposure

With an expense ratio of 0.40%, the iShares Global Energy ETF (NYSE: IXC) tracks the investment results of an index composed of global equities in the energy sector. Some of its 50 holdings include Exxon Mobil, Chevron Corporation, BP PLC, Total SA, and EOG Resources. From its current price of $53.94, we’d like to see it retest $58 initially.

oil prices-StockEarnings

Navigating Today’s Oil Market

With geopolitical tensions showing few signs of easing and supply concerns mounting, investors will likely continue to keep a close eye on oil prices in the weeks ahead. For those looking to position themselves for further upside without betting on a single company, energy-focused ETFs can provide diversified exposure to a sector that could remain in focus as global uncertainty drives commodity markets higher.

Over the last 26 years, he’s taught thousands of investors how to trade news flow and herd mentality using a unique blend of technical and fundamental analysis. Cooper was among the few analysts to spot the financial crisis of 2008, the top of subprime and Alt-A, the death of Lehman Brothers, Bear Stearns, and New Century Financial, and even the Dow’s collapse to 6,500, as well as its recovery. He even called for gold to rally well above $1.500 when it traded under $600. At the moment, Cooper makes use of technical, fundamental and news analysis, to help individual investors grow their wealth. He’s a firm believer that hard work and thorough research will lead to investment success.

Join over 1.2M+ investors/traders who receive daily and weekly notable earnings alerts with predicted move