ajax loader

Loading...


Ride-the-Wave Strategy – Best for Stock Traders

Ride-the-Wave targets multi-day price momentum following a company’s earnings announcement (EA). With this strategy:

  1. Buy a stock one day post-EA if a stock reacts positively post-earnings:
    1. Near the close of trading the EA-day for a pre-market-EA
    2. Near the close of the following day for a post-market-EA
  2. Sell-to-close after 7-10 days, or possibly earlier if a desired price target is reached

Similarly,

  1. short a stock one day post-EA if a stock reacts negatively post-earnings:
    1. near the close of trading the EA-day for a premarket-EA
    2. near the close of the following day for a post-market-EA
  2. then buy-to-close after 7-10 days, or possibly earlier if a desired price target is reached

Important: Ride-the-Wave is predicated on significant price momentum triggered by an EA. The 7-10 day scenario is the maximum trade hold-time. If you see post EA-momentum is halted or reversed by a significant opposite move, re-evaluate your presence in the trade.

This popular StockEarnings screen below will give you a list of stocks that historically exhibit significant price momentum following an EA for the next seven days:

  1. Stocks exhibiting positive post-EA price moves are buy-candidates
  2. Stocks exhibiting negative post-EA price moves are sell/short-candidates

The screen includes those stocks whose Earnings just came out in last two days.

Screen criteria:

  1. Earnings Date Start Date : Current Date + -1 Day
  2. Earnings Date End Date : Current Date + -2 Days
  3. Predicted Move (Next Day) Max : 7%
  4. Predicted Move (On 7th Day) Min : 7%

Strategy Guideline:

  1. Buy the stock if stock has reacted positively. Short the stock if stock has reacted negatively (see above).
  2. Close the position in 7-10 days, or possibly earlier based on price move.

Volatility Crush Strategy - Best for Options Traders

The Volatility Crush strategy is used with stocks that typically experience relatively low-to-moderate price moves (≤4%) following their Earnings Announcements (EA). The basic trade idea is to sell put or call options right before the EA, collecting a credit when options premium is very high due to elevated implied volatility (IV). You then close the position right after the EA by buying the option back much cheaper due to the significant drop in IV that occurs after the mystery of the EA disappears. In assessing this trade, you need to do your homework to ensure you collect sufficient premium to make the trade worthwhile.

This trade is practical due to the low-to-moderate price-move after the EA, which generally won’t significantly affect the options price, unlike an “action” stock, which experience great price moves post-EA. With these symbols, if you’re on the right side of the price move, that’s a great thing. But if you’re on the wrong side of the move, not so great. Consequently, by minimizing the effect of the post-EA price move, you have a much better chance to profit from the reduction in IV without it being ruined by a violent price move.

For this trade, open the position either (1) the night before the EA when the company announces earnings or (2) during the EA day when it announces post-market, generally capturing IV at or close to its peak.

For this trade, open the position either (1) the night before the EA when the company announces earnings or (2) during the EA day when it announces post-market, generally capturing IV at or close to its peak.

This popular stockearnings screen will give you a list of stocks which do not react more than 4% fpost-EA. It includes only those stocks whose earnings are releasing next day.

Screen criteria:

  1. Earnings Date Start Date : Current Date + 1
  2. Earnings Date End Date : Current Date + 1
  3. Predicted Move (Next Day) Max : 4%
  4. Options Type: Weekly

Strategy Guideline:

  1. Options Strategy: Sell Call and Put
  2. Options Strike Price: Current Stock Price – (% Predicated Move x 2)
  3. Expiration Date: It should generally be the closest expiry immediately after the EA.
  4. Buy Insurance: Buying back Call and Put at Strike price which 10% lower than Sell Strike Price is optional but recommended.

Watch Video for More Detail

Volatility Rush Strategy - Best for Options Traders

The Volatility Rush takes advantage of increasing options premiums into earnings announcements (EA) caused by an anticipated rise in Implied Volatility (IV). With this strategy, Buy a Call and Put at-the-money (a long straddle) 2-3 weeks before the EA when IV is lower. Sell the position either (1) the night before the EA when the company announces earnings pre-market, or (2) during the EA day when it announces post-market, generally capturing IV at or close to its peak.

This popular screen will give you a list of stocks whose Options premiums tend to rise into Earnings. It includes only those stocks whose Earnings are at least two weeks away from today.

Screen criteria:

  1. Earnings Date Start Date : Current Date + 15 Days
  2. Earnings Date End Date : Current Date + 30 Days
  3. Predicted Move (Next Day) Min : 5%
  4. Options Type: Weekly or Monthly if that lines up with the two to three-week lead-time for entering the trade

Strategy Guideline:

  1. Buy a Straddle at or close to the money two to three weeks pre-EA.
  2. Sell the position either the night before the EA when the company announces earnings pre-market, or during the EA day when it announces post-market.
  3. Expiration date should generally be the closest expiry immediately after the EA.
  4. Straddle price should not be more 60% of predicted move.

Predicted Move (Volatility)

Similar to Implied Volatility in Options. Expected volatility % based on our Proprietary Volatility Predication Model. We are expecting that stock price will likely to reach % in either direction by the end of next trading session after Earnings are released and not necessarily the closing volatility %.

Why is it important?

    This indicator helps

  1. Knowing expected volatility in stocks after Earnings helps to decide trading stocks before Earnings Announcement.
  2. Taking Advantage of volatility collapse following Earnings Results by using Advance Options strategies such as Spread and Straddles.

Since Last Earnings

Change in share price since last Earnings release.

Why is it Important?

When share has gained more than 10% since it's last Earning release, it tends to over react to minor bad news and give up some gains if not all. So, it contains more downside volatility than upside When share has dropped more than 10% since it's last Earning release, it tends to over react to minor good news and recover some drops if not all. So, it contains more upside volatility than downside.

EPS Surprise (%)

Occurs when a company's reported quarterly or annual profits are above or below analysts' expectations. Here is the formula to derive % EPS Surprice:

Actual EPS - Estimated EPS
------------------------------------- x 100
Estimated EPS

Why is it Important?

Earnings surprises can have a huge impact on a company's stock price. Several studies suggest that positive earnings surprises not only lead to an immediate hike in a stock's price, but also to a gradual increase over time. Hence, it's not surprising that some companies are known for routinely beating earning projections. A negative earnings surprise will usually result in a decline in share price.

Next Day Price Change (%)

Next Regular trading session Closing price following Earnings result.

For After Market Close Earnings, It is a next trading day closing price. For Before Market Open Earnings, It is the same trading day closing price.

Why is it Important?

Next Day price change is a reaction of Earnings result.

Robinhood Stock: The Super App Bears Are Missing

Posted on Jun 11, 2026 by Chris Markoch

Robinhood Stock: The Super App Bears Are Missing

Wall Street has spent years misreading Robinhood Markets (NASDAQ: HOOD). When the commission-free brokerage burst onto the scene, critics dismissed it as a meme-stock casino. The skeptics said the company was a plaything for retail traders chasing GameStop (NYSE: GME) squeezes and Dogecoin moonshots. When the company’s crypto revenues cratered and the stock fell roughly 30% year-to-date through April, those same critics declared the thesis broken.

But they’re still missing the point.

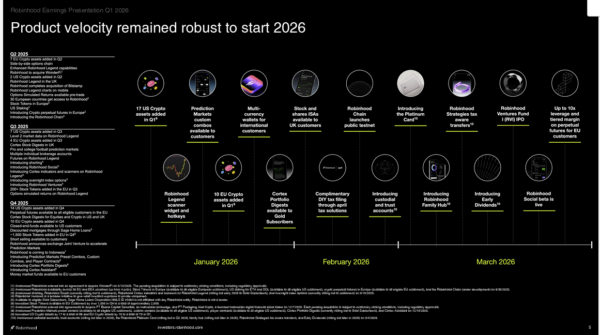
Robinhood isn’t a brokerage with a crypto problem. It’s a vertically integrated financial platform under construction. And management is flooding the zone with product launches faster than analysts can reprice the stock. The Q1 2026 earnings report brought the story to life:

  • Prediction markets are hitting record contract volumes.
  • IPO underwriting is coming online.
  • Trump Accounts positioning Robinhood as a public-sector infrastructure vendor,
  • Bitstamp is providing institutional crypto rails that most fintech competitors don’t have and can’t quickly replicate.

The company’s own CFO framed it plainly on the earnings call. Crypto represents roughly 18% of revenues, and Robinhood has “vastly diversified.” The market heard about the 47% decline in crypto revenue and sold the stock. Long-term investors who read past that headline found a business generating $534 million in adjusted EBITDA at a 50% margin, with $5.2 billion in corporate cash and a freshly authorized $1.5 billion buyback.

At roughly 46x earnings, Robinhood may be the most underappreciated super app in American fintech.

Robinhood Is Building the Financial Stack, Not Just the Trading App


In its Q1 2026 earnings report Robinhood released a new product velocity that reads less like a brokerage and more like a platform company assembling vertical integration piece by piece.

Prediction markets traded 8.8 billion contracts in Q1, up 4% quarter-over-quarter and from essentially nothing 18 months ago. The Rothera joint venture with Susquehanna is set to launch in Q2, giving Robinhood its own prediction market exchange infrastructure rather than routing volume through third parties.

The wealth management stack is scaling simultaneously.

  • Robinhood Strategies hit $1.5 billion in assets under management.
  • The Gold Card now has 765,000 cardholders with $1.1 billion in balances.
  • Robinhood Banking launched and rapidly accumulated $1.6 billion in balances in its first full quarter of reporting.
  • Retirement accounts reached a record $27 billion in assets under custody.
  • Gold subscribers hit 4.34 million, 15.8% of funded customers, and those subscribers carry roughly five times the assets of average users.

This isn’t a trading app with premium features bolted on. It’s a deposit franchise, a wealth manager, an exchange operator, and a card issuer — still being priced like it’s 2021.

robinhood - StockEarnings

Crypto Infrastructure, Not Just Crypto Exposure

Most investors still read Robinhood’s crypto exposure as beta to Bitcoin prices. That framing is increasingly outdated. The Bitstamp acquisition — completed in June 2025 — brought institutional crypto infrastructure, with 94% of Bitstamp’s Q1 2026 notional volume being institutional. That’s custody, lending, and exchange infrastructure for institutional counterparties, not retail traders reacting to price action.

Meanwhile, Robinhood is building the Robinhood Chain and has expanded to 30 EU and EEA countries with stock tokens, crypto perpetual futures, and staking. The company isn’t layering crypto on top of a brokerage. It’s using crypto rails as the foundation for cross-border financial services—a significantly different, more durable architecture than anything legacy brokerages or neobank competitors are fielding. When CEO Vlad Tenev says he wants crypto to function as “infrastructure,” the Bitstamp acquisition and international expansion suggest he means it structurally, not rhetorically.

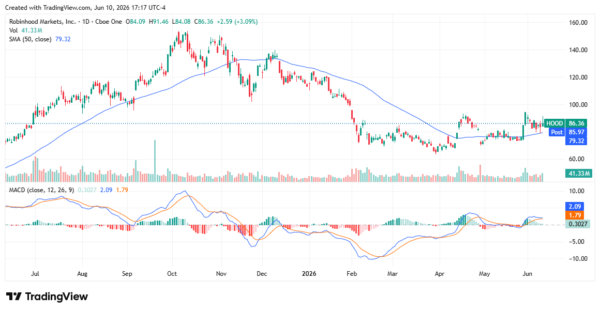
The Chart Is Trying to Tell You Something

After peaking near $143 in September 2025, HOOD spent the better part of seven months in a sustained downtrend, breaking back below its 50-day moving average and finding a floor around $69–$70 in late April following the Q1 earnings miss. The stock’s current pattern is constructive: shares are trading near $86, back above the 50-day SMA sitting at $79, and the MACD has crossed into bullish territory with the signal line and histogram both confirming early momentum.

Volume on recent up days has been above average, consistent with institutional accumulation rather than retail short covering. The May trading update — which showed equity volumes tracking to be the highest month of the year — provided a fundamental catalyst that the technical setup was already anticipating. The prior resistance zone around $85–$90, which capped multiple rally attempts between November 2025 and May 2026, is now the level to watch as potential support. A sustained hold above that range opens the path toward retesting the $100–$110 zone.

robinhood - StockEarnings

Why the Bear Case Still Deserves Respect

No thesis comes without risks, and Robinhood’s business model carries several that are specific and material. The crypto revenue dependency, while declining as a share of the mix, isn’t gone. A prolonged Bitcoin bear market would stress transaction revenues in ways that prediction markets and Gold Card interchange can’t fully offset in the near term.

Regulation remains a persistent overhang. PFOF faces ongoing scrutiny, the Rothera joint venture is a novel structure without a regulatory track record, and event contracts have already drawn legal challenges that management acknowledged could “prevent us from offering” that product.

The Trump Accounts initiative adds $100 million in operating expense to 2026 guidance. The margin on that work is described as “small,” meaning execution risk exists if the program encounters political or logistical delays. International expansion is capital-intensive and faces entrenched local competitors.

And monthly active users actually declined year over year to 13.5 million in Q1 — a metric that matters for long-term platform monetization, regardless of how strong the Gold subscriber cohort looks.

HOOD May Be Entering Its Next Expansion Phase

Robinhood is running a platform playbook that the market is still reading as a brokerage story. With $68 billion in trailing net deposits, a 56% LTM adjusted EBITDA margin, institutional crypto infrastructure, an exchange JV launching this quarter, and a product calendar that includes banking, wealth management, and public-sector fintech — the sum of parts is growing faster than the multiple suggests. The next re-rating catalyst may already be in motion.

A former marketing copywriter turned freelance financial writer and market analyst. I have a passion for delivering insights to investors. I write regularly about stocks for StockEarnings and MarketBeat. Posts are not advice.

Join over 1.2M+ investors/traders who receive daily and weekly notable earnings alerts with predicted move