ajax loader

Loading...


Ride-the-Wave Strategy – Best for Stock Traders

Ride-the-Wave targets multi-day price momentum following a company’s earnings announcement (EA). With this strategy:

  1. Buy a stock one day post-EA if a stock reacts positively post-earnings:
    1. Near the close of trading the EA-day for a pre-market-EA
    2. Near the close of the following day for a post-market-EA
  2. Sell-to-close after 7-10 days, or possibly earlier if a desired price target is reached

Similarly,

  1. short a stock one day post-EA if a stock reacts negatively post-earnings:
    1. near the close of trading the EA-day for a premarket-EA
    2. near the close of the following day for a post-market-EA
  2. then buy-to-close after 7-10 days, or possibly earlier if a desired price target is reached

Important: Ride-the-Wave is predicated on significant price momentum triggered by an EA. The 7-10 day scenario is the maximum trade hold-time. If you see post EA-momentum is halted or reversed by a significant opposite move, re-evaluate your presence in the trade.

This popular StockEarnings screen below will give you a list of stocks that historically exhibit significant price momentum following an EA for the next seven days:

  1. Stocks exhibiting positive post-EA price moves are buy-candidates
  2. Stocks exhibiting negative post-EA price moves are sell/short-candidates

The screen includes those stocks whose Earnings just came out in last two days.

Screen criteria:

  1. Earnings Date Start Date : Current Date + -1 Day
  2. Earnings Date End Date : Current Date + -2 Days
  3. Predicted Move (Next Day) Max : 7%
  4. Predicted Move (On 7th Day) Min : 7%

Strategy Guideline:

  1. Buy the stock if stock has reacted positively. Short the stock if stock has reacted negatively (see above).
  2. Close the position in 7-10 days, or possibly earlier based on price move.

Volatility Crush Strategy - Best for Options Traders

The Volatility Crush strategy is used with stocks that typically experience relatively low-to-moderate price moves (≤4%) following their Earnings Announcements (EA). The basic trade idea is to sell put or call options right before the EA, collecting a credit when options premium is very high due to elevated implied volatility (IV). You then close the position right after the EA by buying the option back much cheaper due to the significant drop in IV that occurs after the mystery of the EA disappears. In assessing this trade, you need to do your homework to ensure you collect sufficient premium to make the trade worthwhile.

This trade is practical due to the low-to-moderate price-move after the EA, which generally won’t significantly affect the options price, unlike an “action” stock, which experience great price moves post-EA. With these symbols, if you’re on the right side of the price move, that’s a great thing. But if you’re on the wrong side of the move, not so great. Consequently, by minimizing the effect of the post-EA price move, you have a much better chance to profit from the reduction in IV without it being ruined by a violent price move.

For this trade, open the position either (1) the night before the EA when the company announces earnings or (2) during the EA day when it announces post-market, generally capturing IV at or close to its peak.

For this trade, open the position either (1) the night before the EA when the company announces earnings or (2) during the EA day when it announces post-market, generally capturing IV at or close to its peak.

This popular stockearnings screen will give you a list of stocks which do not react more than 4% fpost-EA. It includes only those stocks whose earnings are releasing next day.

Screen criteria:

  1. Earnings Date Start Date : Current Date + 1
  2. Earnings Date End Date : Current Date + 1
  3. Predicted Move (Next Day) Max : 4%
  4. Options Type: Weekly

Strategy Guideline:

  1. Options Strategy: Sell Call and Put
  2. Options Strike Price: Current Stock Price – (% Predicated Move x 2)
  3. Expiration Date: It should generally be the closest expiry immediately after the EA.
  4. Buy Insurance: Buying back Call and Put at Strike price which 10% lower than Sell Strike Price is optional but recommended.

Watch Video for More Detail

Volatility Rush Strategy - Best for Options Traders

The Volatility Rush takes advantage of increasing options premiums into earnings announcements (EA) caused by an anticipated rise in Implied Volatility (IV). With this strategy, Buy a Call and Put at-the-money (a long straddle) 2-3 weeks before the EA when IV is lower. Sell the position either (1) the night before the EA when the company announces earnings pre-market, or (2) during the EA day when it announces post-market, generally capturing IV at or close to its peak.

This popular screen will give you a list of stocks whose Options premiums tend to rise into Earnings. It includes only those stocks whose Earnings are at least two weeks away from today.

Screen criteria:

  1. Earnings Date Start Date : Current Date + 15 Days
  2. Earnings Date End Date : Current Date + 30 Days
  3. Predicted Move (Next Day) Min : 5%
  4. Options Type: Weekly or Monthly if that lines up with the two to three-week lead-time for entering the trade

Strategy Guideline:

  1. Buy a Straddle at or close to the money two to three weeks pre-EA.
  2. Sell the position either the night before the EA when the company announces earnings pre-market, or during the EA day when it announces post-market.
  3. Expiration date should generally be the closest expiry immediately after the EA.
  4. Straddle price should not be more 60% of predicted move.

Predicted Move (Volatility)

Similar to Implied Volatility in Options. Expected volatility % based on our Proprietary Volatility Predication Model. We are expecting that stock price will likely to reach % in either direction by the end of next trading session after Earnings are released and not necessarily the closing volatility %.

Why is it important?

    This indicator helps

  1. Knowing expected volatility in stocks after Earnings helps to decide trading stocks before Earnings Announcement.
  2. Taking Advantage of volatility collapse following Earnings Results by using Advance Options strategies such as Spread and Straddles.

Since Last Earnings

Change in share price since last Earnings release.

Why is it Important?

When share has gained more than 10% since it's last Earning release, it tends to over react to minor bad news and give up some gains if not all. So, it contains more downside volatility than upside When share has dropped more than 10% since it's last Earning release, it tends to over react to minor good news and recover some drops if not all. So, it contains more upside volatility than downside.

EPS Surprise (%)

Occurs when a company's reported quarterly or annual profits are above or below analysts' expectations. Here is the formula to derive % EPS Surprice:

Actual EPS - Estimated EPS
------------------------------------- x 100
Estimated EPS

Why is it Important?

Earnings surprises can have a huge impact on a company's stock price. Several studies suggest that positive earnings surprises not only lead to an immediate hike in a stock's price, but also to a gradual increase over time. Hence, it's not surprising that some companies are known for routinely beating earning projections. A negative earnings surprise will usually result in a decline in share price.

Next Day Price Change (%)

Next Regular trading session Closing price following Earnings result.

For After Market Close Earnings, It is a next trading day closing price. For Before Market Open Earnings, It is the same trading day closing price.

Why is it Important?

Next Day price change is a reaction of Earnings result.

Citi Warns Gold Could Fall Another 20% by September — How to Profit 

Posted on Jun 10, 2026 by Ian Cooper

Citi Warns Gold Could Fall Another 20% by September — How to Profit 

Gold prices could fall another 20% by September. That’s according to analysts at Citi, who argue that it could happen if the Strait of Hormuz remains closed until the end of summer. That means an asset generally considered a safe haven asset is higher risk in the short term.

While geopolitical uncertainty often supports gold prices, Citi analysts argue that the current setup creates a unique risk-reward scenario for investors.

“The near-term risk skew therefore looks negative, and dip buying here makes sense only with a strong view of no re-escalation,” analysts noted, as quoted by CNBC. “Longer term, we maintain a bullish gold view, but we believe it is extremely high-risk in the near-term for anyone without very wide stops and longer-term investment horizons.”

Why Gold Could Come Under Pressure


Gold has traditionally served as a hedge against uncertainty, inflation, and financial instability. During periods of market stress, investors often flock to the metal as a store of value.

However, after a powerful run higher, some analysts believe much of the geopolitical risk premium is already reflected in gold prices. 

In addition, expectations surrounding interest rates remain a key variable. If inflation remains stubborn and the Federal Reserve delays additional rate cuts, higher-for-longer interest rates could pressure non-yielding assets like gold.

Investing in mining stocks such as Newmont Gold (NYSE: NEM) or Rio Tinto (NYSE: RIO) has been a popular way to take advantage of the catch-up trade in physical gold, without the custodial concerns. However, if you’re concerned about volatility, you can invest in inverse gold ETFs, or ETFs that do well when the price of gold sinks. That includes: 

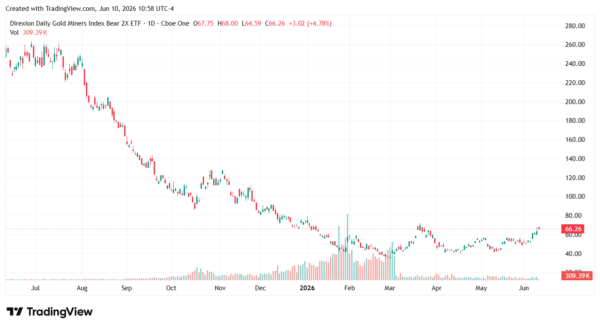
  • Direxion Daily Gold Miners Index Bear 2x Shares ETF (NYSEARCA: DUST): With an expense ratio of 0.93%, the Direxion Daily Gold Miners Index Bear 2x Shares ETF returns 200% of the inverse of the performance of the NYSE ARCA Gold Miners Index. 
gold-StockEarnings
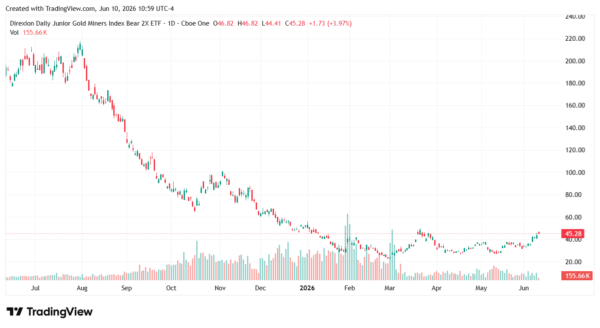
  • Direxion Daily Junior Gold Miners Index Bear 2x Shares ETF (NYSEARCA: JDST): With an expense ratio of 0.89%, the Direxion Daily Junior Gold Miners Index Bear 2x Shares ETF returns 200% of the inverse of the performance of the MVIS Global Junior Gold Miners Index. 
gold-StockEarnings
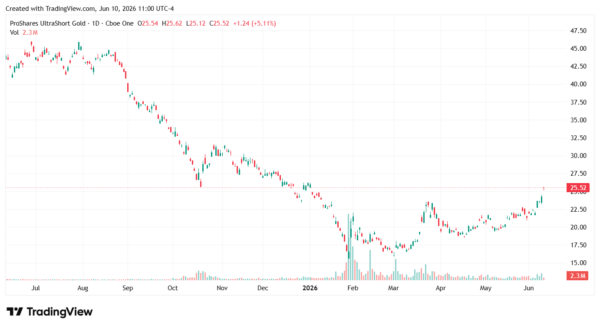
  • ProShares UltraShort Gold ETF (NYSEARCA: GLL): With an expense ratio of 0.95%, the ETF seeks to return 200% of the inverse of the performance of the Bloomberg Gold Subindex. It has also been in a solid downtrend because of gold’s solid uptrend. 
gold-StockEarnings

Long-Term Bull Case Remains Intact

At the same time, there are reasons to be bullish on gold.

For example, JPMorgan says gold prices could test $6,300 in 2026, thanks to an increase in central bank buying. Goldman Sachs is also bullish on gold with a year-end forecast of $5,400 per troy ounce “after increasing its estimates for central bank demand and predicting that official-sector purchases will continue accelerating throughout the remainder of 2026,” as reported by InvestorsHub.com. 

“Looking further ahead, Goldman expects central bank buying to average around 60 tonnes per month through 2026. The bank pointed to findings from its own central bank survey that showed ‘strong underlying interest in gold,’ adding that recent geopolitical tensions “are likely to reinforce diversification over time — both for central banks and private investors.”

Short-Term Weakness, Long-Term Opportunity

While Citi’s warning of a potential 20% decline by September may sound alarming, it reflects growing concerns that the precious metal has become vulnerable after a substantial run-up and amid rapidly changing geopolitical dynamics.

That said, short-term corrections are not uncommon in long-term bull markets. For investors with a longer investment horizon, any weakness in gold could ultimately present an opportunity rather than a reason to abandon the sector altogether. 

Over the last 26 years, he’s taught thousands of investors how to trade news flow and herd mentality using a unique blend of technical and fundamental analysis. Cooper was among the few analysts to spot the financial crisis of 2008, the top of subprime and Alt-A, the death of Lehman Brothers, Bear Stearns, and New Century Financial, and even the Dow’s collapse to 6,500, as well as its recovery. He even called for gold to rally well above $1.500 when it traded under $600. At the moment, Cooper makes use of technical, fundamental and news analysis, to help individual investors grow their wealth. He’s a firm believer that hard work and thorough research will lead to investment success.

Join over 1.2M+ investors/traders who receive daily and weekly notable earnings alerts with predicted move