ajax loader

Loading...


Ride-the-Wave Strategy – Best for Stock Traders

Ride-the-Wave targets multi-day price momentum following a company’s earnings announcement (EA). With this strategy:

  1. Buy a stock one day post-EA if a stock reacts positively post-earnings:
    1. Near the close of trading the EA-day for a pre-market-EA
    2. Near the close of the following day for a post-market-EA
  2. Sell-to-close after 7-10 days, or possibly earlier if a desired price target is reached

Similarly,

  1. short a stock one day post-EA if a stock reacts negatively post-earnings:
    1. near the close of trading the EA-day for a premarket-EA
    2. near the close of the following day for a post-market-EA
  2. then buy-to-close after 7-10 days, or possibly earlier if a desired price target is reached

Important: Ride-the-Wave is predicated on significant price momentum triggered by an EA. The 7-10 day scenario is the maximum trade hold-time. If you see post EA-momentum is halted or reversed by a significant opposite move, re-evaluate your presence in the trade.

This popular StockEarnings screen below will give you a list of stocks that historically exhibit significant price momentum following an EA for the next seven days:

  1. Stocks exhibiting positive post-EA price moves are buy-candidates
  2. Stocks exhibiting negative post-EA price moves are sell/short-candidates

The screen includes those stocks whose Earnings just came out in last two days.

Screen criteria:

  1. Earnings Date Start Date : Current Date + -1 Day
  2. Earnings Date End Date : Current Date + -2 Days
  3. Predicted Move (Next Day) Max : 7%
  4. Predicted Move (On 7th Day) Min : 7%

Strategy Guideline:

  1. Buy the stock if stock has reacted positively. Short the stock if stock has reacted negatively (see above).
  2. Close the position in 7-10 days, or possibly earlier based on price move.

Volatility Crush Strategy - Best for Options Traders

The Volatility Crush strategy is used with stocks that typically experience relatively low-to-moderate price moves (≤4%) following their Earnings Announcements (EA). The basic trade idea is to sell put or call options right before the EA, collecting a credit when options premium is very high due to elevated implied volatility (IV). You then close the position right after the EA by buying the option back much cheaper due to the significant drop in IV that occurs after the mystery of the EA disappears. In assessing this trade, you need to do your homework to ensure you collect sufficient premium to make the trade worthwhile.

This trade is practical due to the low-to-moderate price-move after the EA, which generally won’t significantly affect the options price, unlike an “action” stock, which experience great price moves post-EA. With these symbols, if you’re on the right side of the price move, that’s a great thing. But if you’re on the wrong side of the move, not so great. Consequently, by minimizing the effect of the post-EA price move, you have a much better chance to profit from the reduction in IV without it being ruined by a violent price move.

For this trade, open the position either (1) the night before the EA when the company announces earnings or (2) during the EA day when it announces post-market, generally capturing IV at or close to its peak.

For this trade, open the position either (1) the night before the EA when the company announces earnings or (2) during the EA day when it announces post-market, generally capturing IV at or close to its peak.

This popular stockearnings screen will give you a list of stocks which do not react more than 4% fpost-EA. It includes only those stocks whose earnings are releasing next day.

Screen criteria:

  1. Earnings Date Start Date : Current Date + 1
  2. Earnings Date End Date : Current Date + 1
  3. Predicted Move (Next Day) Max : 4%
  4. Options Type: Weekly

Strategy Guideline:

  1. Options Strategy: Sell Call and Put
  2. Options Strike Price: Current Stock Price – (% Predicated Move x 2)
  3. Expiration Date: It should generally be the closest expiry immediately after the EA.
  4. Buy Insurance: Buying back Call and Put at Strike price which 10% lower than Sell Strike Price is optional but recommended.

Watch Video for More Detail

Volatility Rush Strategy - Best for Options Traders

The Volatility Rush takes advantage of increasing options premiums into earnings announcements (EA) caused by an anticipated rise in Implied Volatility (IV). With this strategy, Buy a Call and Put at-the-money (a long straddle) 2-3 weeks before the EA when IV is lower. Sell the position either (1) the night before the EA when the company announces earnings pre-market, or (2) during the EA day when it announces post-market, generally capturing IV at or close to its peak.

This popular screen will give you a list of stocks whose Options premiums tend to rise into Earnings. It includes only those stocks whose Earnings are at least two weeks away from today.

Screen criteria:

  1. Earnings Date Start Date : Current Date + 15 Days
  2. Earnings Date End Date : Current Date + 30 Days
  3. Predicted Move (Next Day) Min : 5%
  4. Options Type: Weekly or Monthly if that lines up with the two to three-week lead-time for entering the trade

Strategy Guideline:

  1. Buy a Straddle at or close to the money two to three weeks pre-EA.
  2. Sell the position either the night before the EA when the company announces earnings pre-market, or during the EA day when it announces post-market.
  3. Expiration date should generally be the closest expiry immediately after the EA.
  4. Straddle price should not be more 60% of predicted move.

Predicted Move (Volatility)

Similar to Implied Volatility in Options. Expected volatility % based on our Proprietary Volatility Predication Model. We are expecting that stock price will likely to reach % in either direction by the end of next trading session after Earnings are released and not necessarily the closing volatility %.

Why is it important?

    This indicator helps

  1. Knowing expected volatility in stocks after Earnings helps to decide trading stocks before Earnings Announcement.
  2. Taking Advantage of volatility collapse following Earnings Results by using Advance Options strategies such as Spread and Straddles.

Since Last Earnings

Change in share price since last Earnings release.

Why is it Important?

When share has gained more than 10% since it's last Earning release, it tends to over react to minor bad news and give up some gains if not all. So, it contains more downside volatility than upside When share has dropped more than 10% since it's last Earning release, it tends to over react to minor good news and recover some drops if not all. So, it contains more upside volatility than downside.

EPS Surprise (%)

Occurs when a company's reported quarterly or annual profits are above or below analysts' expectations. Here is the formula to derive % EPS Surprice:

Actual EPS - Estimated EPS
------------------------------------- x 100
Estimated EPS

Why is it Important?

Earnings surprises can have a huge impact on a company's stock price. Several studies suggest that positive earnings surprises not only lead to an immediate hike in a stock's price, but also to a gradual increase over time. Hence, it's not surprising that some companies are known for routinely beating earning projections. A negative earnings surprise will usually result in a decline in share price.

Next Day Price Change (%)

Next Regular trading session Closing price following Earnings result.

For After Market Close Earnings, It is a next trading day closing price. For Before Market Open Earnings, It is the same trading day closing price.

Why is it Important?

Next Day price change is a reaction of Earnings result.

The Overlooked Asset Behind Casey’s 800 Million Transactions

Posted on Jun 10, 2026 by Grayson Cavern

The Overlooked Asset Behind Casey’s 800 Million Transactions

How does a company operating mostly in towns with fewer than 20,000 people process 800 million transactions a year?

Casey’s General Stores (NASDAQ: CASY) gave investors another reason to ask that question after reporting a strong fiscal fourth quarter and fiscal year 2026. Fourth-quarter revenue climbed to $4.57 billion while diluted EPS surged 66% to $4.37. For the full fiscal year, revenue reached a record $17.56 billion and diluted EPS climbed to $19.16. On the surface, it looked like another strong earnings report. Yet the figures that kept pulling my attention weren’t revenue or earnings. They were buried elsewhere: 2,944 stores, nearly 10.5 million rewards members, and roughly 800 million annual transactions generated largely from communities many national retailers have spent decades ignoring. 

The Company That Built Where Others Didn’t


Most retailers spent the last few decades chasing population growth. Bigger cities meant more customers, more traffic, and more opportunities to scale. Casey’s took a different path, building store after store across smaller communities where competition was often thinner and customer relationships tended to run deeper.

Today, approximately two-thirds of Casey’s stores are located in towns with populations of 20,000 people or less. That’s an astonishing statistic when you stop and think about it. A company concentrated in rural America has built a footprint large enough to support 10.5 million rewards members and generate 800 million annual transactions. Those aren’t the characteristics of a niche regional retailer. They’re the characteristics of a business operating at a scale most investors don’t immediately associate with Casey’s.

The footprint itself is only part of the story. Supporting nearly 2,944 stores across 19 states requires infrastructure, and Casey’s spent years building it. Three distribution centers now supply roughly 70% of in-store products and approximately 60% of fuel. Long before management started talking about loyalty programs, prepared foods, and digital ordering, the company was laying the foundation that would allow those initiatives to scale efficiently across thousands of locations.

It’s no surprise why the Fourth-quarter net income jumped to $162.7 million from $98.3 million a year ago, while EBITDA climbed to $350.3 million. For the full fiscal year, net income reached $714.4 million and EBITDA climbed to a record $1.48 billion. Casey’s also ended the year with $523 million in cash, repurchased $200.5 million worth of shares during fiscal 2026, and increased its buyback authorization to $1 billion. All of which indicates how productive this network has become.

Why Pizza Keeps Showing Up In The Numbers

The easiest explanation for Casey’s success is pizza.Yes, their breakfast pizza is undefeatable. But the problem is that pizza alone doesn’t explain 800 million transactions.

What pizza does explain is customer behavior.

Prepared-food and fountain same-store sales increased 6.6% during the fourth quarter. More importantly, prepared-food margins expanded to 59.5% from 57.8% a year earlier. A business many investors still categorize as a convenience-store operator is generating restaurant-like margins from one of its fastest-growing categories.

Fuel remains important. Total fuel gallons sold increased 3.6%, same-store fuel gallons rose 1.5%, and fuel gross profit surged 29.1% to $397.4 million. Fuel margins averaged 46.9 cents per gallon. Strong numbers, certainly.

That’s why the pizza moat argument, while simplistic, contains a grain of truth.

People don’t drive across town because they’re emotionally attached to a gallon of gasoline. They absolutely drive across town for food they enjoy. Casey’s pizza has become something of a destination product throughout many of the communities the company serves, creating a reason for customers to choose Casey’s even when competing convenience stores are nearby.

The rest of the inside-store business tells a similar story. Fourth-quarter inside same-store sales increased 5.5%, while inside gross profit climbed 10.5% to $643.4 million. Even more encouraging, inside margin expanded to 42.4% from 41.2% a year ago.

Every one of those figures points in the same direction. Customers aren’t simply stopping at Casey’s, they’re also spending more once they arrive.

Investors Are Now Catching On

The good news is, the market is beginning to appreciate what management has built.

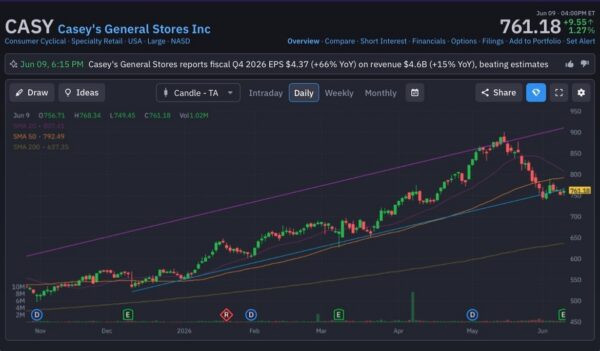
Over the past year, shares climbed from roughly $500 to nearly $900 before entering a consolidation phase that pulled the stock back toward the mid-$700s. Strong stocks often pause after major advances, especially when investors lock in gains following a powerful run. What matters is what happens next.

Casey’s never came close to breaking its longer-term uptrend. Shares remained comfortably above the 200-day moving average near $637 while repeatedly attracting buyers during periods of weakness. The 50-day moving average continues to trend above the 200-day moving average, reinforcing the broader bullish structure, and volume following earnings reflected investors responding positively to another quarter of strong execution rather than searching for an exit.

That reaction makes sense. Revenue is growing. Net income is growing faster. Margins are expanding. Higher-value categories continue gaining traction. Meanwhile, the network supporting all of it remains extraordinarily difficult to replicate.

Casey's-StockEarnings

The Asset Most Investors Are Still Undervaluing

While Pizza attracts attention because it’s easy to understand, the network requires more work.

Yet one appears far more valuable than the other.

Casey’s spent decades building a footprint few competitors could realistically recreate today. This quarter and fiscal year offered another reminder that the company is becoming increasingly effective at monetizing that advantage. The bulls are happy with this.

Join over 1.2M+ investors/traders who receive daily and weekly notable earnings alerts with predicted move