ajax loader

Loading...


Ride-the-Wave Strategy – Best for Stock Traders

Ride-the-Wave targets multi-day price momentum following a company’s earnings announcement (EA). With this strategy:

  1. Buy a stock one day post-EA if a stock reacts positively post-earnings:
    1. Near the close of trading the EA-day for a pre-market-EA
    2. Near the close of the following day for a post-market-EA
  2. Sell-to-close after 7-10 days, or possibly earlier if a desired price target is reached

Similarly,

  1. short a stock one day post-EA if a stock reacts negatively post-earnings:
    1. near the close of trading the EA-day for a premarket-EA
    2. near the close of the following day for a post-market-EA
  2. then buy-to-close after 7-10 days, or possibly earlier if a desired price target is reached

Important: Ride-the-Wave is predicated on significant price momentum triggered by an EA. The 7-10 day scenario is the maximum trade hold-time. If you see post EA-momentum is halted or reversed by a significant opposite move, re-evaluate your presence in the trade.

This popular StockEarnings screen below will give you a list of stocks that historically exhibit significant price momentum following an EA for the next seven days:

  1. Stocks exhibiting positive post-EA price moves are buy-candidates
  2. Stocks exhibiting negative post-EA price moves are sell/short-candidates

The screen includes those stocks whose Earnings just came out in last two days.

Screen criteria:

  1. Earnings Date Start Date : Current Date + -1 Day
  2. Earnings Date End Date : Current Date + -2 Days
  3. Predicted Move (Next Day) Max : 7%
  4. Predicted Move (On 7th Day) Min : 7%

Strategy Guideline:

  1. Buy the stock if stock has reacted positively. Short the stock if stock has reacted negatively (see above).
  2. Close the position in 7-10 days, or possibly earlier based on price move.

Volatility Crush Strategy - Best for Options Traders

The Volatility Crush strategy is used with stocks that typically experience relatively low-to-moderate price moves (≤4%) following their Earnings Announcements (EA). The basic trade idea is to sell put or call options right before the EA, collecting a credit when options premium is very high due to elevated implied volatility (IV). You then close the position right after the EA by buying the option back much cheaper due to the significant drop in IV that occurs after the mystery of the EA disappears. In assessing this trade, you need to do your homework to ensure you collect sufficient premium to make the trade worthwhile.

This trade is practical due to the low-to-moderate price-move after the EA, which generally won’t significantly affect the options price, unlike an “action” stock, which experience great price moves post-EA. With these symbols, if you’re on the right side of the price move, that’s a great thing. But if you’re on the wrong side of the move, not so great. Consequently, by minimizing the effect of the post-EA price move, you have a much better chance to profit from the reduction in IV without it being ruined by a violent price move.

For this trade, open the position either (1) the night before the EA when the company announces earnings or (2) during the EA day when it announces post-market, generally capturing IV at or close to its peak.

For this trade, open the position either (1) the night before the EA when the company announces earnings or (2) during the EA day when it announces post-market, generally capturing IV at or close to its peak.

This popular stockearnings screen will give you a list of stocks which do not react more than 4% fpost-EA. It includes only those stocks whose earnings are releasing next day.

Screen criteria:

  1. Earnings Date Start Date : Current Date + 1
  2. Earnings Date End Date : Current Date + 1
  3. Predicted Move (Next Day) Max : 4%
  4. Options Type: Weekly

Strategy Guideline:

  1. Options Strategy: Sell Call and Put
  2. Options Strike Price: Current Stock Price – (% Predicated Move x 2)
  3. Expiration Date: It should generally be the closest expiry immediately after the EA.
  4. Buy Insurance: Buying back Call and Put at Strike price which 10% lower than Sell Strike Price is optional but recommended.

Watch Video for More Detail

Volatility Rush Strategy - Best for Options Traders

The Volatility Rush takes advantage of increasing options premiums into earnings announcements (EA) caused by an anticipated rise in Implied Volatility (IV). With this strategy, Buy a Call and Put at-the-money (a long straddle) 2-3 weeks before the EA when IV is lower. Sell the position either (1) the night before the EA when the company announces earnings pre-market, or (2) during the EA day when it announces post-market, generally capturing IV at or close to its peak.

This popular screen will give you a list of stocks whose Options premiums tend to rise into Earnings. It includes only those stocks whose Earnings are at least two weeks away from today.

Screen criteria:

  1. Earnings Date Start Date : Current Date + 15 Days
  2. Earnings Date End Date : Current Date + 30 Days
  3. Predicted Move (Next Day) Min : 5%
  4. Options Type: Weekly or Monthly if that lines up with the two to three-week lead-time for entering the trade

Strategy Guideline:

  1. Buy a Straddle at or close to the money two to three weeks pre-EA.
  2. Sell the position either the night before the EA when the company announces earnings pre-market, or during the EA day when it announces post-market.
  3. Expiration date should generally be the closest expiry immediately after the EA.
  4. Straddle price should not be more 60% of predicted move.

Predicted Move (Volatility)

Similar to Implied Volatility in Options. Expected volatility % based on our Proprietary Volatility Predication Model. We are expecting that stock price will likely to reach % in either direction by the end of next trading session after Earnings are released and not necessarily the closing volatility %.

Why is it important?

    This indicator helps

  1. Knowing expected volatility in stocks after Earnings helps to decide trading stocks before Earnings Announcement.
  2. Taking Advantage of volatility collapse following Earnings Results by using Advance Options strategies such as Spread and Straddles.

Since Last Earnings

Change in share price since last Earnings release.

Why is it Important?

When share has gained more than 10% since it's last Earning release, it tends to over react to minor bad news and give up some gains if not all. So, it contains more downside volatility than upside When share has dropped more than 10% since it's last Earning release, it tends to over react to minor good news and recover some drops if not all. So, it contains more upside volatility than downside.

EPS Surprise (%)

Occurs when a company's reported quarterly or annual profits are above or below analysts' expectations. Here is the formula to derive % EPS Surprice:

Actual EPS - Estimated EPS
------------------------------------- x 100
Estimated EPS

Why is it Important?

Earnings surprises can have a huge impact on a company's stock price. Several studies suggest that positive earnings surprises not only lead to an immediate hike in a stock's price, but also to a gradual increase over time. Hence, it's not surprising that some companies are known for routinely beating earning projections. A negative earnings surprise will usually result in a decline in share price.

Next Day Price Change (%)

Next Regular trading session Closing price following Earnings result.

For After Market Close Earnings, It is a next trading day closing price. For Before Market Open Earnings, It is the same trading day closing price.

Why is it Important?

Next Day price change is a reaction of Earnings result.

Oracle’s $95 Billion AI Bet Is Why The Stock Sold Off

Posted on Jun 11, 2026 by Grayson Cavern

Oracle’s $95 Billion AI Bet Is Why The Stock Sold Off

Oracle’s fiscal 2026 earnings report answered one question and raised a much larger one. The numbers were recorded across almost every line that matters;  revenue reached $67.4 billion, cloud infrastructure surged 77%, operating cash flow jumped 54% to $32 billion, and net income climbed 37% to $17.1 billion. Fourth-quarter earnings also showed revenue grew 21% to $19.2 billion, cloud revenue surged 47% to $9.9 billion, and EPS rose 21% to $1.45. By almost any conventional measure, this was the quarter that confirmed Oracle’s transformation from legacy software giant into a ginormous AI infrastructure contender.

Then management revealed the bill – $55.7 billion in capital expenditures during the fiscal year, negative free cash flow of $23.7 billion, $43 billion raised in new debt, and another $5 billion in equity – and the conversation shifted entirely away from the results and toward the cost of producing them.

Oracle Stopped Acting Like A Software Company


For decades, Oracle Corp (NYSE: ORCL) was one of the most legible businesses in enterprise technology; sell software, collect recurring revenue, generate predictable cash flows, return capital to shareholders. That model produced enormous wealth and an investor base conditioned to expect consistency over ambition. What I’m looking at now is categorically different, and the capital structure makes that plain without requiring any interpretation.

A software company operating inside its traditional boundaries does not spend $55.7 billion on infrastructure in a single fiscal year, does not push free cash flow deeply negative, and does not simultaneously raise about $50 billion in external capital unless the opportunity being pursued is large enough to justify restructuring the entire financial profile of the business to chase it. Oracle Corp (NYSE: ORCL) is racing to build capacity before demand overwhelms what it can currently deliver – and the spending reflects management’s read on the urgency of that race, not a loss of financial discipline.

The Number That Changes Everything Else In The Report

Every figure in the 2026 fiscal year and fourth quarter earnings release mattered, but none of them carried the weight of $638 billion – Oracle’s Remaining Performance Obligations, representing contracted future business the company has already secured but not yet recognized as revenue. The company generated $67.4 billion in revenue during fiscal 2026, and its backlog now stands at nearly ten times that amount, with $85 billion of new RPO added in a single quarter alone. To put that in the sharpest possible terms: Oracle added more contracted future business in three months than it generated in revenue across the entire fiscal year.

That figure reframes the capital expenditure conversation completely. The $55.7 billion being spent is not speculative infrastructure built in anticipation of demand that may or may not materialize – it is capacity being constructed against a backlog that already dwarfs the current business. Management added one more detail that I think matters more than most analysts gave it credit for: large AI customers are increasingly prepaying for capacity or providing their own GPUs, with those commitments now totaling $75 billion. Customers are not waiting for Oracle to build. They are actively funding the buildout. That tells you more about the conviction behind future demand than any forward guidance ever could.

The Selloff Was Always About Capital Allocation

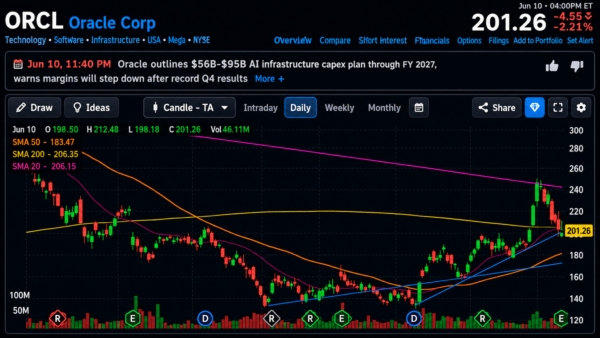
The stock’s reaction tells us exactly where investors became uncomfortable. Oracle entered earnings after a powerful run that carried shares from roughly $135 in April to nearly $250 in early June, a gain of more than 80% in just two months. Throughout that advance, the stock stayed firmly above its rising 20-day moving average and repeatedly found support near the 50-day moving average, signaling aggressive institutional accumulation rather than speculative buying.

Following the release, shares sold off from the $240-$250 area and briefly undercut the 20-day moving average, which now sits near $206. More importantly, buyers immediately showed up near the same zone where the rising trendline intersects with price. Even after the pullback, Oracle remains comfortably above its 50-day moving average at $183.47 and well above the longer-term uptrend that has been in place since April.

More than 46 million shares changed hands during the selloff, making it one of the heaviest trading sessions of the year. That’s significant because the market had every opportunity to punish the stock after management revealed plans to spend as much as $95 billion on AI infrastructure through fiscal 2027. Instead of collapsing through support, Oracle stabilized near the 200-day moving average around $206.

To me, that looks less like investors abandoning the AI story and more like investors recalibrating what they’re willing to pay for it. The market isn’t questioning whether Oracle can grow. Fourth-quarter cloud revenue already proved that. The market is questioning how much spending, borrowing, and near-term margin pressure should be tolerated before those investments begin showing up in future earnings.

As long as Oracle continues holding above the rising 50-day moving average and the broader trend structure remains in place, the selloff looks more like a reaction to the size of the investment plan than a verdict on the business itself.

oracle-StockEarnings

The Rational Spending

Most earnings reactions focus on what a company accomplished in the period being reported. Oracle’s report redirected my attention entirely toward what management believes is coming, and the behavior of a company that expects demand to moderate does not look anything like this. 

The stock sold off because the spending figures were genuinely enormous. But so is a backlog approaching two-thirds of a trillion dollars, and that figure is the one I keep returning to, because it explains why management is willing to spend at a pace that makes the rest of the market deeply uncomfortable.

When the backlog is ten times your annual revenue, uncomfortable spending starts to look like the only rational response.

Join over 1.2M+ investors/traders who receive daily and weekly notable earnings alerts with predicted move