ajax loader

Loading...


Ride-the-Wave Strategy – Best for Stock Traders

Ride-the-Wave targets multi-day price momentum following a company’s earnings announcement (EA). With this strategy:

  1. Buy a stock one day post-EA if a stock reacts positively post-earnings:
    1. Near the close of trading the EA-day for a pre-market-EA
    2. Near the close of the following day for a post-market-EA
  2. Sell-to-close after 7-10 days, or possibly earlier if a desired price target is reached

Similarly,

  1. short a stock one day post-EA if a stock reacts negatively post-earnings:
    1. near the close of trading the EA-day for a premarket-EA
    2. near the close of the following day for a post-market-EA
  2. then buy-to-close after 7-10 days, or possibly earlier if a desired price target is reached

Important: Ride-the-Wave is predicated on significant price momentum triggered by an EA. The 7-10 day scenario is the maximum trade hold-time. If you see post EA-momentum is halted or reversed by a significant opposite move, re-evaluate your presence in the trade.

This popular StockEarnings screen below will give you a list of stocks that historically exhibit significant price momentum following an EA for the next seven days:

  1. Stocks exhibiting positive post-EA price moves are buy-candidates
  2. Stocks exhibiting negative post-EA price moves are sell/short-candidates

The screen includes those stocks whose Earnings just came out in last two days.

Screen criteria:

  1. Earnings Date Start Date : Current Date + -1 Day
  2. Earnings Date End Date : Current Date + -2 Days
  3. Predicted Move (Next Day) Max : 7%
  4. Predicted Move (On 7th Day) Min : 7%

Strategy Guideline:

  1. Buy the stock if stock has reacted positively. Short the stock if stock has reacted negatively (see above).
  2. Close the position in 7-10 days, or possibly earlier based on price move.

Volatility Crush Strategy - Best for Options Traders

The Volatility Crush strategy is used with stocks that typically experience relatively low-to-moderate price moves (≤4%) following their Earnings Announcements (EA). The basic trade idea is to sell put or call options right before the EA, collecting a credit when options premium is very high due to elevated implied volatility (IV). You then close the position right after the EA by buying the option back much cheaper due to the significant drop in IV that occurs after the mystery of the EA disappears. In assessing this trade, you need to do your homework to ensure you collect sufficient premium to make the trade worthwhile.

This trade is practical due to the low-to-moderate price-move after the EA, which generally won’t significantly affect the options price, unlike an “action” stock, which experience great price moves post-EA. With these symbols, if you’re on the right side of the price move, that’s a great thing. But if you’re on the wrong side of the move, not so great. Consequently, by minimizing the effect of the post-EA price move, you have a much better chance to profit from the reduction in IV without it being ruined by a violent price move.

For this trade, open the position either (1) the night before the EA when the company announces earnings or (2) during the EA day when it announces post-market, generally capturing IV at or close to its peak.

For this trade, open the position either (1) the night before the EA when the company announces earnings or (2) during the EA day when it announces post-market, generally capturing IV at or close to its peak.

This popular stockearnings screen will give you a list of stocks which do not react more than 4% fpost-EA. It includes only those stocks whose earnings are releasing next day.

Screen criteria:

  1. Earnings Date Start Date : Current Date + 1
  2. Earnings Date End Date : Current Date + 1
  3. Predicted Move (Next Day) Max : 4%
  4. Options Type: Weekly

Strategy Guideline:

  1. Options Strategy: Sell Call and Put
  2. Options Strike Price: Current Stock Price – (% Predicated Move x 2)
  3. Expiration Date: It should generally be the closest expiry immediately after the EA.
  4. Buy Insurance: Buying back Call and Put at Strike price which 10% lower than Sell Strike Price is optional but recommended.

Watch Video for More Detail

Volatility Rush Strategy - Best for Options Traders

The Volatility Rush takes advantage of increasing options premiums into earnings announcements (EA) caused by an anticipated rise in Implied Volatility (IV). With this strategy, Buy a Call and Put at-the-money (a long straddle) 2-3 weeks before the EA when IV is lower. Sell the position either (1) the night before the EA when the company announces earnings pre-market, or (2) during the EA day when it announces post-market, generally capturing IV at or close to its peak.

This popular screen will give you a list of stocks whose Options premiums tend to rise into Earnings. It includes only those stocks whose Earnings are at least two weeks away from today.

Screen criteria:

  1. Earnings Date Start Date : Current Date + 15 Days
  2. Earnings Date End Date : Current Date + 30 Days
  3. Predicted Move (Next Day) Min : 5%
  4. Options Type: Weekly or Monthly if that lines up with the two to three-week lead-time for entering the trade

Strategy Guideline:

  1. Buy a Straddle at or close to the money two to three weeks pre-EA.
  2. Sell the position either the night before the EA when the company announces earnings pre-market, or during the EA day when it announces post-market.
  3. Expiration date should generally be the closest expiry immediately after the EA.
  4. Straddle price should not be more 60% of predicted move.

Predicted Move (Volatility)

Similar to Implied Volatility in Options. Expected volatility % based on our Proprietary Volatility Predication Model. We are expecting that stock price will likely to reach % in either direction by the end of next trading session after Earnings are released and not necessarily the closing volatility %.

Why is it important?

    This indicator helps

  1. Knowing expected volatility in stocks after Earnings helps to decide trading stocks before Earnings Announcement.
  2. Taking Advantage of volatility collapse following Earnings Results by using Advance Options strategies such as Spread and Straddles.

Since Last Earnings

Change in share price since last Earnings release.

Why is it Important?

When share has gained more than 10% since it's last Earning release, it tends to over react to minor bad news and give up some gains if not all. So, it contains more downside volatility than upside When share has dropped more than 10% since it's last Earning release, it tends to over react to minor good news and recover some drops if not all. So, it contains more upside volatility than downside.

EPS Surprise (%)

Occurs when a company's reported quarterly or annual profits are above or below analysts' expectations. Here is the formula to derive % EPS Surprice:

Actual EPS - Estimated EPS
------------------------------------- x 100
Estimated EPS

Why is it Important?

Earnings surprises can have a huge impact on a company's stock price. Several studies suggest that positive earnings surprises not only lead to an immediate hike in a stock's price, but also to a gradual increase over time. Hence, it's not surprising that some companies are known for routinely beating earning projections. A negative earnings surprise will usually result in a decline in share price.

Next Day Price Change (%)

Next Regular trading session Closing price following Earnings result.

For After Market Close Earnings, It is a next trading day closing price. For Before Market Open Earnings, It is the same trading day closing price.

Why is it Important?

Next Day price change is a reaction of Earnings result.

Oracle Report Looms: AI Boom Drives Expectations

Posted on Jun 09, 2026 by Ian Cooper

Oracle Report Looms: AI Boom Drives Expectations

On June 10, Oracle (NYSE: ORCL) will be one of the most closely watched stocks on Wall Street this week as investors look for fresh insight into the company’s artificial intelligence strategy, cloud computing growth, and long-term revenue outlook. 

With ORCL shares surging over the last year on booming demand for AI infrastructure and cloud services, the upcoming earnings report could serve as a major catalyst for the stock. 

Analysts are expecting strong revenue and earnings growth, but the real focus will be on Oracle Cloud Infrastructure (OCI), AI-related demand, backlog expansion, and management’s guidance for fiscal 2027. Also, as competition intensifies across the AI and cloud computing markets, Oracle’s results could offer important clues about the next phase of growth for both the company and the broader AI sector.

What Wall Street Expects


Analysts are calling for ORCL to report EPS of $1.96 per share on revenue of about $19.1 billion, representing year-over-year growth of roughly 15% and 20%, respectively. 

Oracle’s own guidance issued during its third-quarter report called for revenue growth of 19% to 21% and non-GAAP EPS between $1.96 and $2.00, putting current analyst expectations near the middle of management’s projected range. 

And while earnings and revenue will matter, investors are likely to focus most heavily on Oracle Cloud Infrastructure (OCI) – which is expected to see revenue growth of about 90% year over year. Analysts will also listen for management commentary regarding capacity expansion, GPU availability, and future demand trends. 

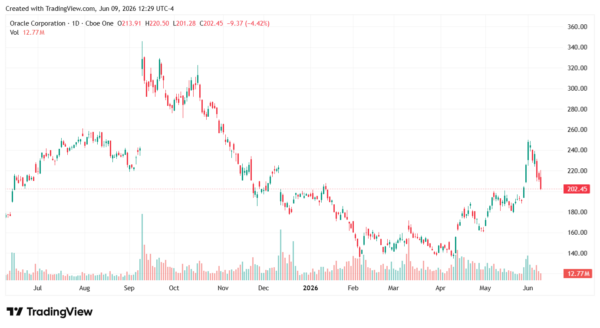
Fueling more upside, analysts at Bank of America, for example, just reiterated a buy on ORCL ahead of Wednesday’s earnings. “We reiterate our Buy rating and raise our PO to $240 from $200, based on 26.5x our CY27E P/E estimates vs 22x prior, as underlying demand trends remain robust across both cloud infrastructure and database workloads.”

Analysts at Oppenheimer reiterated an outperform rating on the ORCL stock with a price target of $275. The firm cited strong growth in Oracle Cloud Infrastructure (OCI), increased IT demand, and solid cloud earnings.

Analysts at Evercore reiterated an outperform rating on the stock with a price target of $245. The firm cited ongoing momentum in Oracle Cloud Infrastructure (OCI) and positive strategic positioning heading into the company’s fiscal fourth-quarter earnings.

oracle-StockEarnings

Backlog Growth Could Be Another Catalyst

Another key metric is Remaining Performance Obligations (RPO), which represents contracted future revenue. Analysts expect Oracle’s backlog to continue climbing toward record levels, potentially approaching $600 billion. 

That could provide further evidence that demand for Oracle’s cloud and AI services remains exceptionally strong and could support revenue growth for years to come.  Strong RPO growth has been one of the primary drivers behind Wall Street’s increasingly bullish outlook on Oracle over the last year. 

Analysts will also be listening for strong 2027 guidance, in addition to updated revenue targets, cloud growth forecasts, and capital expenditure plans. Any indication that AI demand continues to exceed Oracle’s available capacity could be viewed positively by investors. 

Oracle’s AI Growth Story in Focus

In short, ORCL enters its June earnings report as one of the market’s most closely watched AI infrastructure plays. With Wall Street expecting approximately $19.1 billion in revenue and earnings of $1.96 per share, the focus will extend far beyond the headline numbers. Investors will be watching OCI growth, backlog expansion, AI-related demand, and fiscal 2027 guidance for clues about Oracle’s next phase of growth. If management can demonstrate that its AI-driven cloud momentum remains intact, Oracle could reinforce its position as one of the biggest beneficiaries of the ongoing artificial intelligence boom. 

Over the last 26 years, he’s taught thousands of investors how to trade news flow and herd mentality using a unique blend of technical and fundamental analysis. Cooper was among the few analysts to spot the financial crisis of 2008, the top of subprime and Alt-A, the death of Lehman Brothers, Bear Stearns, and New Century Financial, and even the Dow’s collapse to 6,500, as well as its recovery. He even called for gold to rally well above $1.500 when it traded under $600. At the moment, Cooper makes use of technical, fundamental and news analysis, to help individual investors grow their wealth. He’s a firm believer that hard work and thorough research will lead to investment success.

Join over 1.2M+ investors/traders who receive daily and weekly notable earnings alerts with predicted move