ajax loader

Loading...


Ride-the-Wave Strategy – Best for Stock Traders

Ride-the-Wave targets multi-day price momentum following a company’s earnings announcement (EA). With this strategy:

  1. Buy a stock one day post-EA if a stock reacts positively post-earnings:
    1. Near the close of trading the EA-day for a pre-market-EA
    2. Near the close of the following day for a post-market-EA
  2. Sell-to-close after 7-10 days, or possibly earlier if a desired price target is reached

Similarly,

  1. short a stock one day post-EA if a stock reacts negatively post-earnings:
    1. near the close of trading the EA-day for a premarket-EA
    2. near the close of the following day for a post-market-EA
  2. then buy-to-close after 7-10 days, or possibly earlier if a desired price target is reached

Important: Ride-the-Wave is predicated on significant price momentum triggered by an EA. The 7-10 day scenario is the maximum trade hold-time. If you see post EA-momentum is halted or reversed by a significant opposite move, re-evaluate your presence in the trade.

This popular StockEarnings screen below will give you a list of stocks that historically exhibit significant price momentum following an EA for the next seven days:

  1. Stocks exhibiting positive post-EA price moves are buy-candidates
  2. Stocks exhibiting negative post-EA price moves are sell/short-candidates

The screen includes those stocks whose Earnings just came out in last two days.

Screen criteria:

  1. Earnings Date Start Date : Current Date + -1 Day
  2. Earnings Date End Date : Current Date + -2 Days
  3. Predicted Move (Next Day) Max : 7%
  4. Predicted Move (On 7th Day) Min : 7%

Strategy Guideline:

  1. Buy the stock if stock has reacted positively. Short the stock if stock has reacted negatively (see above).
  2. Close the position in 7-10 days, or possibly earlier based on price move.

Volatility Crush Strategy - Best for Options Traders

The Volatility Crush strategy is used with stocks that typically experience relatively low-to-moderate price moves (≤4%) following their Earnings Announcements (EA). The basic trade idea is to sell put or call options right before the EA, collecting a credit when options premium is very high due to elevated implied volatility (IV). You then close the position right after the EA by buying the option back much cheaper due to the significant drop in IV that occurs after the mystery of the EA disappears. In assessing this trade, you need to do your homework to ensure you collect sufficient premium to make the trade worthwhile.

This trade is practical due to the low-to-moderate price-move after the EA, which generally won’t significantly affect the options price, unlike an “action” stock, which experience great price moves post-EA. With these symbols, if you’re on the right side of the price move, that’s a great thing. But if you’re on the wrong side of the move, not so great. Consequently, by minimizing the effect of the post-EA price move, you have a much better chance to profit from the reduction in IV without it being ruined by a violent price move.

For this trade, open the position either (1) the night before the EA when the company announces earnings or (2) during the EA day when it announces post-market, generally capturing IV at or close to its peak.

For this trade, open the position either (1) the night before the EA when the company announces earnings or (2) during the EA day when it announces post-market, generally capturing IV at or close to its peak.

This popular stockearnings screen will give you a list of stocks which do not react more than 4% fpost-EA. It includes only those stocks whose earnings are releasing next day.

Screen criteria:

  1. Earnings Date Start Date : Current Date + 1
  2. Earnings Date End Date : Current Date + 1
  3. Predicted Move (Next Day) Max : 4%
  4. Options Type: Weekly

Strategy Guideline:

  1. Options Strategy: Sell Call and Put
  2. Options Strike Price: Current Stock Price – (% Predicated Move x 2)
  3. Expiration Date: It should generally be the closest expiry immediately after the EA.
  4. Buy Insurance: Buying back Call and Put at Strike price which 10% lower than Sell Strike Price is optional but recommended.

Watch Video for More Detail

Volatility Rush Strategy - Best for Options Traders

The Volatility Rush takes advantage of increasing options premiums into earnings announcements (EA) caused by an anticipated rise in Implied Volatility (IV). With this strategy, Buy a Call and Put at-the-money (a long straddle) 2-3 weeks before the EA when IV is lower. Sell the position either (1) the night before the EA when the company announces earnings pre-market, or (2) during the EA day when it announces post-market, generally capturing IV at or close to its peak.

This popular screen will give you a list of stocks whose Options premiums tend to rise into Earnings. It includes only those stocks whose Earnings are at least two weeks away from today.

Screen criteria:

  1. Earnings Date Start Date : Current Date + 15 Days
  2. Earnings Date End Date : Current Date + 30 Days
  3. Predicted Move (Next Day) Min : 5%
  4. Options Type: Weekly or Monthly if that lines up with the two to three-week lead-time for entering the trade

Strategy Guideline:

  1. Buy a Straddle at or close to the money two to three weeks pre-EA.
  2. Sell the position either the night before the EA when the company announces earnings pre-market, or during the EA day when it announces post-market.
  3. Expiration date should generally be the closest expiry immediately after the EA.
  4. Straddle price should not be more 60% of predicted move.

Predicted Move (Volatility)

Similar to Implied Volatility in Options. Expected volatility % based on our Proprietary Volatility Predication Model. We are expecting that stock price will likely to reach % in either direction by the end of next trading session after Earnings are released and not necessarily the closing volatility %.

Why is it important?

    This indicator helps

  1. Knowing expected volatility in stocks after Earnings helps to decide trading stocks before Earnings Announcement.
  2. Taking Advantage of volatility collapse following Earnings Results by using Advance Options strategies such as Spread and Straddles.

Since Last Earnings

Change in share price since last Earnings release.

Why is it Important?

When share has gained more than 10% since it's last Earning release, it tends to over react to minor bad news and give up some gains if not all. So, it contains more downside volatility than upside When share has dropped more than 10% since it's last Earning release, it tends to over react to minor good news and recover some drops if not all. So, it contains more upside volatility than downside.

EPS Surprise (%)

Occurs when a company's reported quarterly or annual profits are above or below analysts' expectations. Here is the formula to derive % EPS Surprice:

Actual EPS - Estimated EPS
------------------------------------- x 100
Estimated EPS

Why is it Important?

Earnings surprises can have a huge impact on a company's stock price. Several studies suggest that positive earnings surprises not only lead to an immediate hike in a stock's price, but also to a gradual increase over time. Hence, it's not surprising that some companies are known for routinely beating earning projections. A negative earnings surprise will usually result in a decline in share price.

Next Day Price Change (%)

Next Regular trading session Closing price following Earnings result.

For After Market Close Earnings, It is a next trading day closing price. For Before Market Open Earnings, It is the same trading day closing price.

Why is it Important?

Next Day price change is a reaction of Earnings result.

Walmart Stock Just Flashed a Rare Quant Signal for the Bulls

Posted on Jul 22, 2026 by Joshua Enomoto

Walmart Stock Just Flashed a Rare Quant Signal for the Bulls

For those who are seeking a relative scalp — within the next four weeks — Walmart (NYSE: WMT) should be one of the names to consider. As a big-box retailer with an indelible footprint in the economy, WMT stock is often considered a no-brainer for a long-term portfolio. But the beauty here is that the inherent stability of the ticker also offers a catalyst for short-term speculation when the conditions are ripe.

My argument? The conditions for bullishly betting on WMT stock appear ripe right now.

No, I’m not going to waste your time going over all the past metrics that every other financial publication has discussed ad nauseum. As you know, once important information becomes public, that news is instantaneously digested by the top institutions and hedge funds. You as a retail trader will never win the latency game.

It doesn’t matter what Bob from Arkansas thinks about the price/earnings ratio, the revenue growth, the free cash flow yield or any number of financial metrics. If there was an edge that Walmart’s Form 10-Q offered, just save yourself the heartache with the realization that this edge has already been priced in.

As I said before, we cannot win the information latency game and that goes especially for WMT stock, one of the world’s most heavily traded tickers. Instead, we must rely on the structural footprints that such securities leave behind.

Our job isn’t to determine or predict where Walmart stock may end up at a given point in time. Instead, the theory is that different market triggers cause changes to how WMT typically responds. By identifying the trigger and studying the historical response, we gain a better idea of where the ticker may end up — not because we think so but because we observe the data.

From my analysis, the trigger is that WMT stock has structurally suffered an extended downturn. Since May 19, Walmart is down nearly 15%. With such a steep loss, there’s a strong possibility that rules-based trading algorithms may view the security as a discount.

Focusing on the Machines, Not the People Behind WMT Stock


This is where the fundamental stability of Walmart stock comes into play. Unlike flash-in-the-pan securities which are subject to constantly shifting sentiment regimes, the narrative for WMT is straightforward: everyday low prices, baby!

Is it a silly thing to say? Perhaps but here’s the deal: Walmart often is the low-cost leader for the products that consumers want and need. Whether you’re talking groceries or video games, Walmart practically stocks it all. So while there are sentiment regimes that can impact WMT stock, the movement is relatively limited as the core business model is incredibly durable.

What does that mean for the quant trader? It means that they have greater confidence in isolating triggers or signals to exploit structural footprints. Since any sentiment regimes are statistically likely to be limited, traders may theoretically be able to stick their necks out more.
walmart-StockEarnings

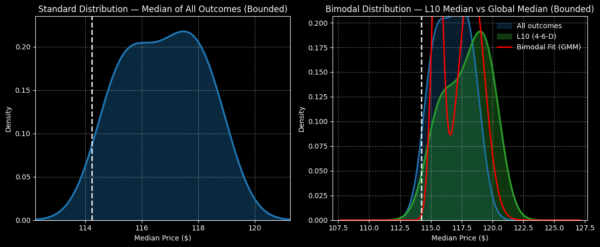
And what exactly is this trigger for WMT stock? In the past 10 weeks, WMT stock has printed only four up weeks, leading to a downward slope. This 4-6-D signal has remarkably only materialized 28 times on a rolling basis since January 2019. You’d think that for such a popular security, this sample size would be greater but no, it’s only 28 occurrences.

What’s more interesting is what happens after this signal flashes. Over the next 10 weeks, the forward distribution would be expected to land between $112.50 and $122.50 (assuming a starting price of $114.24), with probability density peaking around $118.50. It’s a slightly better performance than the random baseline, where WMT stock would be expected to range between $112 and $122, with probability density peaking at $117.50.

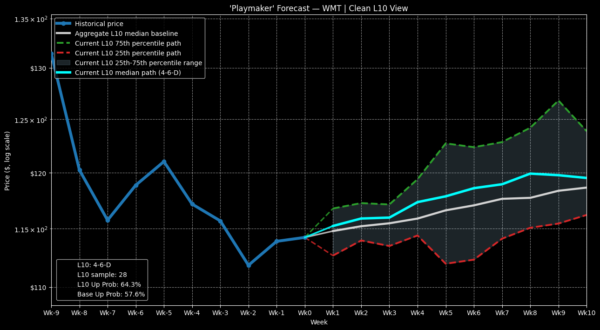
However, the real highlight is that the performance variance between the signal and the random baseline is not orderly and linear. Specifically, week 4 following the flashing of the 4-6-D signal leads to a median bump of roughly 2.9%. That would mean that WMT stock, if prior patterns were to hold true, is likely to reach around $117.50 on week 4.

By knowing that, we can better plan our options trading strategy.

Targeting a Specific Trade for Walmart Stock

Based on the inductive evidence above, I believe a compelling case can be made for the 116/118 bull call spread expiring Aug. 14 (which is the equivalent of week 4 in the model above). Traders will be hoping for Walmart stock to rise through the $118 strike at expiration to trigger the maximum payout, which stands at over 106%. Further, the net debit is reasonable (given the thinness of the spread) at only $97 per spread.
walmart-StockEarnings

Generally speaking, traders who seek a higher probability of success go for wider wings (or the difference between the legs of the options spread). This action creates a broader range for the target security to hit, thereby providing a more forgiving breakeven price. Of course, every move has a catch. Here, traders must pay a more expensive premium for the increased margin of safety.

Now, for the 116/118 bull spread, the breakeven price clocks in at $116.97, which is quite high. As a result, the market assigns a low probability of breaking even at only 36.9%. However, this calculation is theoretical. Stemming from the Black-Scholes formula — which assumes a risk-neutral, lognormal environment — the 36.9% probability represents the distance (in standard deviations) between the current spot price and the target price.

In other words, if Black-Scholes best represented reality, the 116/118 spread has less than a 40% chance of breaking even. However, I don’t believe that to be the case. Because WMT stock printed a rare quantitative signal, it has been proven more likely that the ticker may positively mean revert.
walmart-StockEarnings

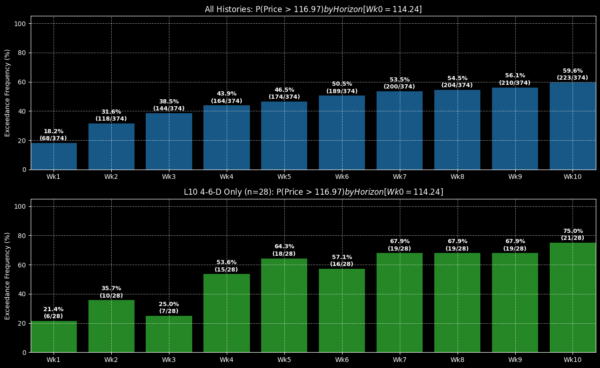
Specifically, of the 28 times that the aforementioned signal flashed, Walmart stock has exceeded the equivalent of the $116.97 breakeven price a total of 15 times at the end of week 4. As such, the probability of profit could actually be 53.6% on a conditional and observational framework. That’s 1,670 basis points of “free odds,” which is why I’m excited about WMT stock.

You’re just not going to see too many instances of such wide probability variances for a stable powerhouse like Walmart. I want to be clear that this doesn’t necessarily make WMT stock a guaranteed win. Still, if you’re of the speculating type, I would argue that the big-box retailer makes a statistically compelling case for itself.


Joshua Enomoto is a seasoned financial writer with a strong track record of in-depth stock analysis, offering clear, insightful commentary for retail investors across all levels of expertise. Renowned for his ability to blend analytical rigor with engaging wit, Joshua's work has been featured on leading investment platforms, including TipRanks, InvestorPlace, Barchart, Benzinga, and Fintel. He was also handpicked to spearhead high-impact initiatives such as InvestorPlace's "Trade of the Day" and Benzinga’s ETF coverage. As a frequent guest expert for CGTN America, Joshua discusses a wide range of economic, societal, and consumer market trends. A graduate of U.C. San Diego, Joshua brings a thoughtful and fresh perspective to complex financial narratives, helping enterprise clients connect with their audiences. He also composes music in his spare time.

Join over 1.2M+ investors/traders who receive daily and weekly notable earnings alerts with predicted move