ajax loader

Loading...


Ride-the-Wave Strategy – Best for Stock Traders

Ride-the-Wave targets multi-day price momentum following a company’s earnings announcement (EA). With this strategy:

  1. Buy a stock one day post-EA if a stock reacts positively post-earnings:
    1. Near the close of trading the EA-day for a pre-market-EA
    2. Near the close of the following day for a post-market-EA
  2. Sell-to-close after 7-10 days, or possibly earlier if a desired price target is reached

Similarly,

  1. short a stock one day post-EA if a stock reacts negatively post-earnings:
    1. near the close of trading the EA-day for a premarket-EA
    2. near the close of the following day for a post-market-EA
  2. then buy-to-close after 7-10 days, or possibly earlier if a desired price target is reached

Important: Ride-the-Wave is predicated on significant price momentum triggered by an EA. The 7-10 day scenario is the maximum trade hold-time. If you see post EA-momentum is halted or reversed by a significant opposite move, re-evaluate your presence in the trade.

This popular StockEarnings screen below will give you a list of stocks that historically exhibit significant price momentum following an EA for the next seven days:

  1. Stocks exhibiting positive post-EA price moves are buy-candidates
  2. Stocks exhibiting negative post-EA price moves are sell/short-candidates

The screen includes those stocks whose Earnings just came out in last two days.

Screen criteria:

  1. Earnings Date Start Date : Current Date + -1 Day
  2. Earnings Date End Date : Current Date + -2 Days
  3. Predicted Move (Next Day) Max : 7%
  4. Predicted Move (On 7th Day) Min : 7%

Strategy Guideline:

  1. Buy the stock if stock has reacted positively. Short the stock if stock has reacted negatively (see above).
  2. Close the position in 7-10 days, or possibly earlier based on price move.

Volatility Crush Strategy - Best for Options Traders

The Volatility Crush strategy is used with stocks that typically experience relatively low-to-moderate price moves (≤4%) following their Earnings Announcements (EA). The basic trade idea is to sell put or call options right before the EA, collecting a credit when options premium is very high due to elevated implied volatility (IV). You then close the position right after the EA by buying the option back much cheaper due to the significant drop in IV that occurs after the mystery of the EA disappears. In assessing this trade, you need to do your homework to ensure you collect sufficient premium to make the trade worthwhile.

This trade is practical due to the low-to-moderate price-move after the EA, which generally won’t significantly affect the options price, unlike an “action” stock, which experience great price moves post-EA. With these symbols, if you’re on the right side of the price move, that’s a great thing. But if you’re on the wrong side of the move, not so great. Consequently, by minimizing the effect of the post-EA price move, you have a much better chance to profit from the reduction in IV without it being ruined by a violent price move.

For this trade, open the position either (1) the night before the EA when the company announces earnings or (2) during the EA day when it announces post-market, generally capturing IV at or close to its peak.

For this trade, open the position either (1) the night before the EA when the company announces earnings or (2) during the EA day when it announces post-market, generally capturing IV at or close to its peak.

This popular stockearnings screen will give you a list of stocks which do not react more than 4% fpost-EA. It includes only those stocks whose earnings are releasing next day.

Screen criteria:

  1. Earnings Date Start Date : Current Date + 1
  2. Earnings Date End Date : Current Date + 1
  3. Predicted Move (Next Day) Max : 4%
  4. Options Type: Weekly

Strategy Guideline:

  1. Options Strategy: Sell Call and Put
  2. Options Strike Price: Current Stock Price – (% Predicated Move x 2)
  3. Expiration Date: It should generally be the closest expiry immediately after the EA.
  4. Buy Insurance: Buying back Call and Put at Strike price which 10% lower than Sell Strike Price is optional but recommended.

Watch Video for More Detail

Volatility Rush Strategy - Best for Options Traders

The Volatility Rush takes advantage of increasing options premiums into earnings announcements (EA) caused by an anticipated rise in Implied Volatility (IV). With this strategy, Buy a Call and Put at-the-money (a long straddle) 2-3 weeks before the EA when IV is lower. Sell the position either (1) the night before the EA when the company announces earnings pre-market, or (2) during the EA day when it announces post-market, generally capturing IV at or close to its peak.

This popular screen will give you a list of stocks whose Options premiums tend to rise into Earnings. It includes only those stocks whose Earnings are at least two weeks away from today.

Screen criteria:

  1. Earnings Date Start Date : Current Date + 15 Days
  2. Earnings Date End Date : Current Date + 30 Days
  3. Predicted Move (Next Day) Min : 5%
  4. Options Type: Weekly or Monthly if that lines up with the two to three-week lead-time for entering the trade

Strategy Guideline:

  1. Buy a Straddle at or close to the money two to three weeks pre-EA.
  2. Sell the position either the night before the EA when the company announces earnings pre-market, or during the EA day when it announces post-market.
  3. Expiration date should generally be the closest expiry immediately after the EA.
  4. Straddle price should not be more 60% of predicted move.

Predicted Move (Volatility)

Similar to Implied Volatility in Options. Expected volatility % based on our Proprietary Volatility Predication Model. We are expecting that stock price will likely to reach % in either direction by the end of next trading session after Earnings are released and not necessarily the closing volatility %.

Why is it important?

    This indicator helps

  1. Knowing expected volatility in stocks after Earnings helps to decide trading stocks before Earnings Announcement.
  2. Taking Advantage of volatility collapse following Earnings Results by using Advance Options strategies such as Spread and Straddles.

Since Last Earnings

Change in share price since last Earnings release.

Why is it Important?

When share has gained more than 10% since it's last Earning release, it tends to over react to minor bad news and give up some gains if not all. So, it contains more downside volatility than upside When share has dropped more than 10% since it's last Earning release, it tends to over react to minor good news and recover some drops if not all. So, it contains more upside volatility than downside.

EPS Surprise (%)

Occurs when a company's reported quarterly or annual profits are above or below analysts' expectations. Here is the formula to derive % EPS Surprice:

Actual EPS - Estimated EPS
------------------------------------- x 100
Estimated EPS

Why is it Important?

Earnings surprises can have a huge impact on a company's stock price. Several studies suggest that positive earnings surprises not only lead to an immediate hike in a stock's price, but also to a gradual increase over time. Hence, it's not surprising that some companies are known for routinely beating earning projections. A negative earnings surprise will usually result in a decline in share price.

Next Day Price Change (%)

Next Regular trading session Closing price following Earnings result.

For After Market Close Earnings, It is a next trading day closing price. For Before Market Open Earnings, It is the same trading day closing price.

Why is it Important?

Next Day price change is a reaction of Earnings result.

Uranium Energy (UEC) Q4 Earnings: Production Is Racing Ahead of Revenue

Posted on Sep 30, 2026 by Grayson Cavern

Uranium Energy (UEC) Q4 Earnings: Production Is Racing Ahead of Revenue

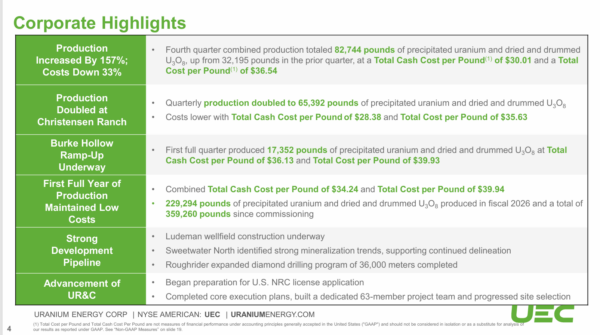
Uranium Energy Corp. (NYSE American: UEC) sold 400,000 pounds of uranium during fiscal 2026 after producing only 229,294 pounds, and that was the first number I wanted to chase before getting too hung up on the -12 cents Q4 EPS.

The company generated $37.3 million from those sales at a realized price of $93.13 per pound, while Q4 production had already jumped 157% to 82,744 pounds and total production cost had fallen to $36.54 per pound.

There is a pretty large gap between those numbers, and following it leads somewhere more useful than another uranium-demand argument.

UEC Sold From An Inventory That Barely Moved


If UEC produced 229,294 pounds but sold 400,000, the extra 170,706 pounds had to come from uranium already in inventory. UEC entered FY2026 with 1.356 million pounds of purchased uranium, bought another 300,000 pounds during the year, and sold 400,000 pounds, leaving 1.256 million pounds at July 31.  That leaves us with a company that sold a meaningful amount of uranium without drawing down its purchased inventory by anything close to the amount sold.
uec - StockEarnings

Then there was the uranium coming out of the mines. UEC finished FY2026 with another 359,260 pounds of precipitated, dried, and drummed uranium at its Irigaray and Hobson processing plants. UEC excludes that material from the $109 million market value it assigns to the 1.256 million pounds of purchased uranium.

Add the two disclosed quantities and UEC had roughly 1.615 million pounds of physical uranium at year-end. That is my calculation from the company’s figures, rather than a number UEC reports as a single inventory balance, but it gives us a useful sense of scale: the physical position was roughly four times the 400,000 pounds sold during the year. The income statement looks much different when you know that.

Production Accelerated While Sales Slowed

UEC’s uranium revenue dropped from $66.8 million in FY2025 to $37.3 million in FY2026, but its realized uranium price went from $82.52 to $93.13 per pound. The volume sold fell from 810,000 pounds to 400,000 pounds, which explains most of the revenue decline. 

Production was doing the exact opposite. FY2026 production reached 229,294 pounds, up roughly 76% from the prior year, and Q4 alone contributed 82,744 pounds. Christensen Ranch produced 65,392 pounds in Q4 at a total cost of $35.63 per pound, down from $54.61 in Q3, while Burke Hollow added 17,352 pounds at $39.93 per pound.

That Q4 production figure annualizes to roughly 331,000 pounds if repeated for four quarters. I wouldn’t treat that as guidance, but it gives us a clean look at the production rate UEC reached as FY2026 ended.

There is more capacity coming behind it, too. Four additional header houses at Christensen received final approvals on September 28, with production expected to begin in the following weeks. UEC is also constructing the Ludeman wellfield and advancing Sweetwater and Roughrider.

UEC therefore entered FY2027 with more uranium production coming online and a substantial inventory already sitting behind the operation.

The Balance Sheet Gives Management Time To Hold It

That inventory strategy would look very different if UEC needed immediate cash to keep the mines running. It finished FY2026 with $495 million of cash, $753 million of liquid assets and no debt. The $753 million includes cash, equity securities, and uranium inventories marked at market prices, so the entire figure shouldn’t be treated as cash.

The company is also 100% unhedged. That leaves UEC with considerable exposure to uranium prices, but it also means the 1.256 million pounds of purchased uranium aren’t locked into contracts that dictate when they have to be sold. That is why I don’t read the $37.3 million FY2026 revenue number as the finished earning power of the operation. UEC was selling inventory while expanding production, and the balance sheet gave it enough liquidity to keep doing both. The valuation work attached to the stock makes a similar bet, although it requires a much bigger jump.

The Fair-Value Case Needs The Inventory To Become Earnings

Multiple investors already see UEC as undervalued, with fair-value scenarios stretching up to $26 a share. The bullish cases are built around the same pieces we just traced: a much larger production base, the uranium inventory being monetized at higher prices, and the company’s expansion into a broader U.S. nuclear-fuel platform.

Those estimates require substantial execution, particularly because UEC remains 100% unhedged and the refining and conversion project is still being developed, but the current share price leaves plenty of room between today’s valuation and those longer-term scenarios.

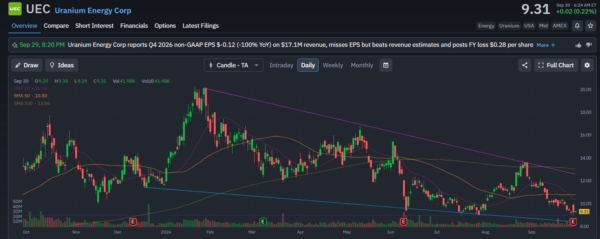
The chart is still ugly. UEC is around $9.31, below its 20-day, 50-day, and 200-day moving averages at roughly $10.36, $10.80, and $13.06, while sitting close to the $8.91 52-week low. I actually like that setup here because the operating numbers are improving while the stock is still being priced around the weakness in today’s earnings.
uec - StockEarnings

At roughly $9, I’m comfortable owning UEC. The company has a growing production base, falling unit costs, more than a million pounds of purchased uranium still in inventory, additional produced uranium sitting at its processing plants, $495 million of cash and no debt. If more of those pounds move through the income statement as production scales, the earnings profile can look very different from the $37.3 million FY2026 revenue figure.

The market doesn’t have to recognize all of that at once. UEC only needs to keep converting the physical uranium it has accumulated into a larger, cheaper, and more profitable production business.


Join over 1.2M+ investors/traders who receive daily and weekly notable earnings alerts with predicted move