ajax loader

Loading...


Ride-the-Wave Strategy – Best for Stock Traders

Ride-the-Wave targets multi-day price momentum following a company’s earnings announcement (EA). With this strategy:

  1. Buy a stock one day post-EA if a stock reacts positively post-earnings:
    1. Near the close of trading the EA-day for a pre-market-EA
    2. Near the close of the following day for a post-market-EA
  2. Sell-to-close after 7-10 days, or possibly earlier if a desired price target is reached

Similarly,

  1. short a stock one day post-EA if a stock reacts negatively post-earnings:
    1. near the close of trading the EA-day for a premarket-EA
    2. near the close of the following day for a post-market-EA
  2. then buy-to-close after 7-10 days, or possibly earlier if a desired price target is reached

Important: Ride-the-Wave is predicated on significant price momentum triggered by an EA. The 7-10 day scenario is the maximum trade hold-time. If you see post EA-momentum is halted or reversed by a significant opposite move, re-evaluate your presence in the trade.

This popular StockEarnings screen below will give you a list of stocks that historically exhibit significant price momentum following an EA for the next seven days:

  1. Stocks exhibiting positive post-EA price moves are buy-candidates
  2. Stocks exhibiting negative post-EA price moves are sell/short-candidates

The screen includes those stocks whose Earnings just came out in last two days.

Screen criteria:

  1. Earnings Date Start Date : Current Date + -1 Day
  2. Earnings Date End Date : Current Date + -2 Days
  3. Predicted Move (Next Day) Max : 7%
  4. Predicted Move (On 7th Day) Min : 7%

Strategy Guideline:

  1. Buy the stock if stock has reacted positively. Short the stock if stock has reacted negatively (see above).
  2. Close the position in 7-10 days, or possibly earlier based on price move.

Volatility Crush Strategy - Best for Options Traders

The Volatility Crush strategy is used with stocks that typically experience relatively low-to-moderate price moves (≤4%) following their Earnings Announcements (EA). The basic trade idea is to sell put or call options right before the EA, collecting a credit when options premium is very high due to elevated implied volatility (IV). You then close the position right after the EA by buying the option back much cheaper due to the significant drop in IV that occurs after the mystery of the EA disappears. In assessing this trade, you need to do your homework to ensure you collect sufficient premium to make the trade worthwhile.

This trade is practical due to the low-to-moderate price-move after the EA, which generally won’t significantly affect the options price, unlike an “action” stock, which experience great price moves post-EA. With these symbols, if you’re on the right side of the price move, that’s a great thing. But if you’re on the wrong side of the move, not so great. Consequently, by minimizing the effect of the post-EA price move, you have a much better chance to profit from the reduction in IV without it being ruined by a violent price move.

For this trade, open the position either (1) the night before the EA when the company announces earnings or (2) during the EA day when it announces post-market, generally capturing IV at or close to its peak.

For this trade, open the position either (1) the night before the EA when the company announces earnings or (2) during the EA day when it announces post-market, generally capturing IV at or close to its peak.

This popular stockearnings screen will give you a list of stocks which do not react more than 4% fpost-EA. It includes only those stocks whose earnings are releasing next day.

Screen criteria:

  1. Earnings Date Start Date : Current Date + 1
  2. Earnings Date End Date : Current Date + 1
  3. Predicted Move (Next Day) Max : 4%
  4. Options Type: Weekly

Strategy Guideline:

  1. Options Strategy: Sell Call and Put
  2. Options Strike Price: Current Stock Price – (% Predicated Move x 2)
  3. Expiration Date: It should generally be the closest expiry immediately after the EA.
  4. Buy Insurance: Buying back Call and Put at Strike price which 10% lower than Sell Strike Price is optional but recommended.

Watch Video for More Detail

Volatility Rush Strategy - Best for Options Traders

The Volatility Rush takes advantage of increasing options premiums into earnings announcements (EA) caused by an anticipated rise in Implied Volatility (IV). With this strategy, Buy a Call and Put at-the-money (a long straddle) 2-3 weeks before the EA when IV is lower. Sell the position either (1) the night before the EA when the company announces earnings pre-market, or (2) during the EA day when it announces post-market, generally capturing IV at or close to its peak.

This popular screen will give you a list of stocks whose Options premiums tend to rise into Earnings. It includes only those stocks whose Earnings are at least two weeks away from today.

Screen criteria:

  1. Earnings Date Start Date : Current Date + 15 Days
  2. Earnings Date End Date : Current Date + 30 Days
  3. Predicted Move (Next Day) Min : 5%
  4. Options Type: Weekly or Monthly if that lines up with the two to three-week lead-time for entering the trade

Strategy Guideline:

  1. Buy a Straddle at or close to the money two to three weeks pre-EA.
  2. Sell the position either the night before the EA when the company announces earnings pre-market, or during the EA day when it announces post-market.
  3. Expiration date should generally be the closest expiry immediately after the EA.
  4. Straddle price should not be more 60% of predicted move.

Predicted Move (Volatility)

Similar to Implied Volatility in Options. Expected volatility % based on our Proprietary Volatility Predication Model. We are expecting that stock price will likely to reach % in either direction by the end of next trading session after Earnings are released and not necessarily the closing volatility %.

Why is it important?

    This indicator helps

  1. Knowing expected volatility in stocks after Earnings helps to decide trading stocks before Earnings Announcement.
  2. Taking Advantage of volatility collapse following Earnings Results by using Advance Options strategies such as Spread and Straddles.

Since Last Earnings

Change in share price since last Earnings release.

Why is it Important?

When share has gained more than 10% since it's last Earning release, it tends to over react to minor bad news and give up some gains if not all. So, it contains more downside volatility than upside When share has dropped more than 10% since it's last Earning release, it tends to over react to minor good news and recover some drops if not all. So, it contains more upside volatility than downside.

EPS Surprise (%)

Occurs when a company's reported quarterly or annual profits are above or below analysts' expectations. Here is the formula to derive % EPS Surprice:

Actual EPS - Estimated EPS
------------------------------------- x 100
Estimated EPS

Why is it Important?

Earnings surprises can have a huge impact on a company's stock price. Several studies suggest that positive earnings surprises not only lead to an immediate hike in a stock's price, but also to a gradual increase over time. Hence, it's not surprising that some companies are known for routinely beating earning projections. A negative earnings surprise will usually result in a decline in share price.

Next Day Price Change (%)

Next Regular trading session Closing price following Earnings result.

For After Market Close Earnings, It is a next trading day closing price. For Before Market Open Earnings, It is the same trading day closing price.

Why is it Important?

Next Day price change is a reaction of Earnings result.

Gold Has Pulled Back. Morgan Stanley Still Sees Reasons to Own It

Posted on Sep 30, 2026 by Ian Cooper

Gold Has Pulled Back. Morgan Stanley Still Sees Reasons to Own It

Gold has lost some of its shine lately. But according to Morgan Stanley, the recent selloff hasn’t erased the reasons investors were buying. All of which also creates opportunity in down, but not out, gold stocks, such as Newmont Corporation (NYSE: NEM), Agnico Eagle Mines (NYSE: AEM), Royal Gold (NASDAQ: RGLD), and Barrick Mining Corp. (NYSE: B).

Rising bond yields are making interest-paying investments more attractive. At the same time, central bank buying and concerns about government debt continue to support the longer-term investment case for gold.

Amy Gower, head of metals and mining strategy for Morgan Stanley (NYSE: MS), remains positive on the yellow metal over the next 12 months. Her argument comes down to three factors: strong physical demand, uncertainty surrounding government finances, and the possibility that today’s pressure from interest rates eventually eases.

Central Banks Are Still Buying


One of the most powerful catalysts supporting gold is central-bank demand. According to figures cited by the World Gold Council (WGC), global central banks purchased an estimated 289 metric tonnes of gold during the second quarter. They reportedly added another 23 tonnes in July. The WGC added that emerging-market central banks have been especially active, with China and Poland adding about 20 tonnes and eight tonnes, respectively. 

China’s appetite extends beyond its central bank. The country’s total gold imports, which include private and institutional demand, exceeded 1,000 metric tons during the first eight months of the year, according to the council. Gower said Chinese gold imports were on track for their highest level since 2017. 

That demand matters because central-bank purchases can provide a relatively steady source of buying even when investor sentiment changes. It also suggests that the forces supporting gold extend beyond short-term trading in futures and exchange-traded funds.

The price could also benefit from concerns surrounding government spending, rising debt levels and the de-dollarization by some countries. In addition, Greenlight Capital founder David Einhorn is bullish. As reported by GoldSilver.com, Einhorn believes gold could “significantly outperform” the Nasdaq over the next three to five years. His outlook is based partly on concerns about loose U.S. fiscal policy and the continuing global trend toward de-dollarization.

For gold investors, those trends create a potentially important distinction between short-term price pressure and the longer-term demand picture. Higher yields can make gold less attractive in the near term, but they do not necessarily eliminate the reasons central banks and other investors hold the metal.

In short, the longer-term case is still strong, despite rising interest rates. Central banks are still accumulating the metal, government debt continues to rise, and investors remain concerned about inflation, currency stability, and geopolitical risk. If those trends persist, Goldman Sachs’ $5,400 forecast may not be as aggressive as it initially appears.

Lower Oil Prices Could Help

Oil is another variable worth watching.

A rapid easing of the Middle East conflict could help bring energy prices down. In turn, cheaper oil could reduce inflation pressure and ease concerns that interest rates need to move higher.

That could provide some breathing room.

The relationship between oil, inflation, and gold is not straightforward, but a sustained decline in energy prices could change the broader macroeconomic backdrop. If inflation cools without a major deterioration in economic growth, markets could begin pricing in less pressure on interest rates, potentially removing one of the metal’s current headwinds.

The sequence isn’t guaranteed. Lower energy prices would not automatically produce lower bond yields, and easing geopolitical tensions could also reduce demand for traditional havens.

Nevertheless, Gower’s point is that investors should consider how changes in oil prices could alter the interest-rate outlook.

What Investors Should Watch Next

Gower views $4,000 as an area of strong potential support. Investors should treat that as an analyst’s assessment, rather than a guaranteed price floor. Economic releases, Federal Reserve decisions, and movements in Treasury yields could all keep prices volatile through the final quarter of 2026.

That makes the next several months particularly important. A stabilization in Treasury yields, continued central-bank purchases, or evidence of resilient physical demand could help determine whether the recent pullback becomes a longer consolidation or the beginning of another move higher.

The longer-term argument is more patient. Central banks are still buying, Chinese demand remains substantial, and concerns about government finances haven’t disappeared.

Gold doesn’t need every development to work in its favor to regain momentum. But investors will want evidence that physical demand remains resilient and pressure from yields is easing.

For now, Morgan Stanley sees enough support to remain positive over a 12-month horizon, even if getting there involves further uncomfortable swings.
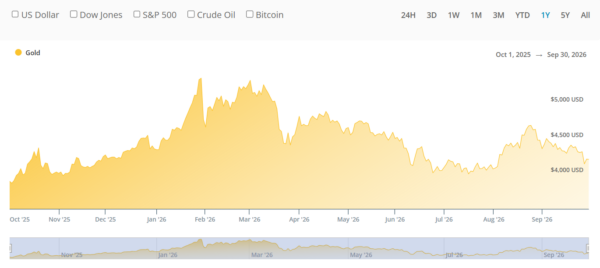
gold - StockEarnings
Source: APMEX

Over the last 26 years, he’s taught thousands of investors how to trade news flow and herd mentality using a unique blend of technical and fundamental analysis. Cooper was among the few analysts to spot the financial crisis of 2008, the top of subprime and Alt-A, the death of Lehman Brothers, Bear Stearns, and New Century Financial, and even the Dow’s collapse to 6,500, as well as its recovery. He even called for gold to rally well above $1.500 when it traded under $600. At the moment, Cooper makes use of technical, fundamental and news analysis, to help individual investors grow their wealth. He’s a firm believer that hard work and thorough research will lead to investment success.

Join over 1.2M+ investors/traders who receive daily and weekly notable earnings alerts with predicted move
