ajax loader

Loading...


Ride-the-Wave Strategy – Best for Stock Traders

Ride-the-Wave targets multi-day price momentum following a company’s earnings announcement (EA). With this strategy:

  1. Buy a stock one day post-EA if a stock reacts positively post-earnings:
    1. Near the close of trading the EA-day for a pre-market-EA
    2. Near the close of the following day for a post-market-EA
  2. Sell-to-close after 7-10 days, or possibly earlier if a desired price target is reached

Similarly,

  1. short a stock one day post-EA if a stock reacts negatively post-earnings:
    1. near the close of trading the EA-day for a premarket-EA
    2. near the close of the following day for a post-market-EA
  2. then buy-to-close after 7-10 days, or possibly earlier if a desired price target is reached

Important: Ride-the-Wave is predicated on significant price momentum triggered by an EA. The 7-10 day scenario is the maximum trade hold-time. If you see post EA-momentum is halted or reversed by a significant opposite move, re-evaluate your presence in the trade.

This popular StockEarnings screen below will give you a list of stocks that historically exhibit significant price momentum following an EA for the next seven days:

  1. Stocks exhibiting positive post-EA price moves are buy-candidates
  2. Stocks exhibiting negative post-EA price moves are sell/short-candidates

The screen includes those stocks whose Earnings just came out in last two days.

Screen criteria:

  1. Earnings Date Start Date : Current Date + -1 Day
  2. Earnings Date End Date : Current Date + -2 Days
  3. Predicted Move (Next Day) Max : 7%
  4. Predicted Move (On 7th Day) Min : 7%

Strategy Guideline:

  1. Buy the stock if stock has reacted positively. Short the stock if stock has reacted negatively (see above).
  2. Close the position in 7-10 days, or possibly earlier based on price move.

Volatility Crush Strategy - Best for Options Traders

The Volatility Crush strategy is used with stocks that typically experience relatively low-to-moderate price moves (≤4%) following their Earnings Announcements (EA). The basic trade idea is to sell put or call options right before the EA, collecting a credit when options premium is very high due to elevated implied volatility (IV). You then close the position right after the EA by buying the option back much cheaper due to the significant drop in IV that occurs after the mystery of the EA disappears. In assessing this trade, you need to do your homework to ensure you collect sufficient premium to make the trade worthwhile.

This trade is practical due to the low-to-moderate price-move after the EA, which generally won’t significantly affect the options price, unlike an “action” stock, which experience great price moves post-EA. With these symbols, if you’re on the right side of the price move, that’s a great thing. But if you’re on the wrong side of the move, not so great. Consequently, by minimizing the effect of the post-EA price move, you have a much better chance to profit from the reduction in IV without it being ruined by a violent price move.

For this trade, open the position either (1) the night before the EA when the company announces earnings or (2) during the EA day when it announces post-market, generally capturing IV at or close to its peak.

For this trade, open the position either (1) the night before the EA when the company announces earnings or (2) during the EA day when it announces post-market, generally capturing IV at or close to its peak.

This popular stockearnings screen will give you a list of stocks which do not react more than 4% fpost-EA. It includes only those stocks whose earnings are releasing next day.

Screen criteria:

  1. Earnings Date Start Date : Current Date + 1
  2. Earnings Date End Date : Current Date + 1
  3. Predicted Move (Next Day) Max : 4%
  4. Options Type: Weekly

Strategy Guideline:

  1. Options Strategy: Sell Call and Put
  2. Options Strike Price: Current Stock Price – (% Predicated Move x 2)
  3. Expiration Date: It should generally be the closest expiry immediately after the EA.
  4. Buy Insurance: Buying back Call and Put at Strike price which 10% lower than Sell Strike Price is optional but recommended.

Watch Video for More Detail

Volatility Rush Strategy - Best for Options Traders

The Volatility Rush takes advantage of increasing options premiums into earnings announcements (EA) caused by an anticipated rise in Implied Volatility (IV). With this strategy, Buy a Call and Put at-the-money (a long straddle) 2-3 weeks before the EA when IV is lower. Sell the position either (1) the night before the EA when the company announces earnings pre-market, or (2) during the EA day when it announces post-market, generally capturing IV at or close to its peak.

This popular screen will give you a list of stocks whose Options premiums tend to rise into Earnings. It includes only those stocks whose Earnings are at least two weeks away from today.

Screen criteria:

  1. Earnings Date Start Date : Current Date + 15 Days
  2. Earnings Date End Date : Current Date + 30 Days
  3. Predicted Move (Next Day) Min : 5%
  4. Options Type: Weekly or Monthly if that lines up with the two to three-week lead-time for entering the trade

Strategy Guideline:

  1. Buy a Straddle at or close to the money two to three weeks pre-EA.
  2. Sell the position either the night before the EA when the company announces earnings pre-market, or during the EA day when it announces post-market.
  3. Expiration date should generally be the closest expiry immediately after the EA.
  4. Straddle price should not be more 60% of predicted move.

Predicted Move (Volatility)

Similar to Implied Volatility in Options. Expected volatility % based on our Proprietary Volatility Predication Model. We are expecting that stock price will likely to reach % in either direction by the end of next trading session after Earnings are released and not necessarily the closing volatility %.

Why is it important?

    This indicator helps

  1. Knowing expected volatility in stocks after Earnings helps to decide trading stocks before Earnings Announcement.
  2. Taking Advantage of volatility collapse following Earnings Results by using Advance Options strategies such as Spread and Straddles.

Since Last Earnings

Change in share price since last Earnings release.

Why is it Important?

When share has gained more than 10% since it's last Earning release, it tends to over react to minor bad news and give up some gains if not all. So, it contains more downside volatility than upside When share has dropped more than 10% since it's last Earning release, it tends to over react to minor good news and recover some drops if not all. So, it contains more upside volatility than downside.

EPS Surprise (%)

Occurs when a company's reported quarterly or annual profits are above or below analysts' expectations. Here is the formula to derive % EPS Surprice:

Actual EPS - Estimated EPS
------------------------------------- x 100
Estimated EPS

Why is it Important?

Earnings surprises can have a huge impact on a company's stock price. Several studies suggest that positive earnings surprises not only lead to an immediate hike in a stock's price, but also to a gradual increase over time. Hence, it's not surprising that some companies are known for routinely beating earning projections. A negative earnings surprise will usually result in a decline in share price.

Next Day Price Change (%)

Next Regular trading session Closing price following Earnings result.

For After Market Close Earnings, It is a next trading day closing price. For Before Market Open Earnings, It is the same trading day closing price.

Why is it Important?

Next Day price change is a reaction of Earnings result.

Why On Holding (ONON) Stock May Be So Bad, It’s Good

Posted on Sep 30, 2026 by Joshua Enomoto

Why On Holding (ONON) Stock May Be So Bad, It’s Good

It’s no exaggeration to say that On Holding (NYSE: ONON) has been a massive disappointment. With even sector giants like Nike (NYSE: NKE) struggling for momentum, the harsh macroeconomic environment spared no mercy for ONON stock. That has especially been true following its second-quarter earnings disaster. Still, there’s a contrarian argument to be made that most of the bad news could be baked in.

Just to recap, the Swiss-based athletic sports company — which specializes in the design, development, and distribution of premium performance footwear and apparel — posted revenue of $8.59 billion. Unfortunately, this haul fell severely short of the consensus expectation of $9.75 billion. As a result, ONON stock suffered a massive drawdown of more than 20%.

Quite frankly, there was little reason for investors to carry more risk than was necessary. To be fair, against the year-ago quarter, the company did quite well, seeing a 22% lift in net sales (at constant currency). But according to Google Finance’s summary sheet, bearish factors — including wholesale softness and tariff risks — clouded the overall narrative for On Holding stock.

With this new reality having been reflected in the market valuation for the company, the options market is now offering significant rewards for those who want to take the opposite side of the bet. And at first glance, the proposed deals may seem enticing. At the same time, traders should be aware of the broader sentiment risks.
Primarily, the smart money seems uninterested in long exposure in On Holding stock. If you look at the volatility skew for the October monthly options chain, the main prioritization appears to be pricing in upside convexity — possibly hinting at a near-term dead-cat bounce. But place the focus on the November monthly and suddenly, the skew seems to favor downside protection.

Further, the probabilistic math doesn’t initially seem to justify bullish trades.

Woeful Probabilities Infer a Negative Outcome for ONON Stock


Under standard financial logic, most experts (perhaps all experts) would likely advise you to stay away from ONON stock. Narrative-wise, there will probably be an anthropomorphism about On Holding needing to prove itself worthy of your hard-earned capital. Technically speaking, the ticker looks like a falling knife, thanks to its 52-week loss of more than 31%.

And the hits will keep coming when you consider the probabilities of success. As a benchmark ambitious idea, let’s consider the 32.50/35 bull call spread expiring Nov. 20. In order for this trade to work, On Holding stock must rise almost 17% to trigger the $35 second-leg strike on expiration day. If it does, the $94 net debit paid will turn into a $156 profit.

On paper, the deal sounds promising, in large part because of the trade’s positive asymmetry favoring the debit-side trader. You risk $94, and if all goes to plan, you get a profit of $156. Of course, the conditional statement is where reality slaps you across the face. Just to break even at $33.44 (on expiration), the odds of this event occurring sit at only 28%.
onon - StockEarnings

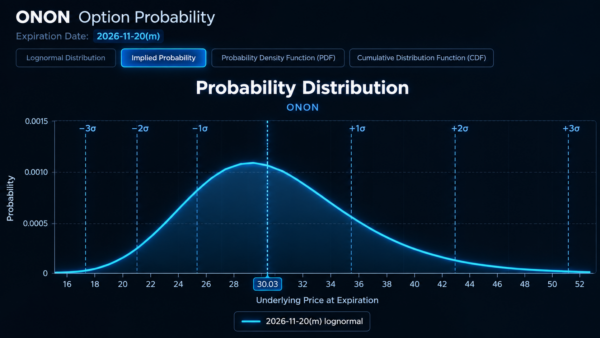
If you wanted to figure out what the chance is of ONON stock hitting $35 on Nov. 20, you can turn to OptionCharts.io’s Probability Distribution screener. Simply roll your mouse to the target price, and you’ll discover a probability of 18.26%.

You can see the problem in terms of expected value. In theory, the idea of targeting only positively asymmetric trades makes sense: you’ll lose many wagers, but when you do win, you’ll win big. That sounds great on paper, but this only works if the trade’s payout is so asymmetrically skewed that it can overcome a low probability like 18.26%.

The practical problem is that Wall Street isn’t stupid. You’re not going to get free payouts. Therefore, if ONON stock were to be a rational trade, you can’t change the reward structure. What you can change, though, is the presupposition that goes into baking the probabilities that you see.

Yes, You Can “Change” the Probabilities of On Holdings Stock

There seems to be a hidden reluctance among Americans about the concept of challenging “official” statistics — I’m not sure if this is a remnant of the Protestant work ethic. But rest assured that when you see Black-Scholes-derived probabilities, they should not be treated automatically as gospel truth.

Instead, they are presuppositional — and this concept is philosophically unavoidable. Because the unknown future is, by definition, unknown, you cannot deterministically state that a particular presupposition is somehow privileged. You must audit the underlying assumptions and come to a conclusion that you find the most convincing and credible.

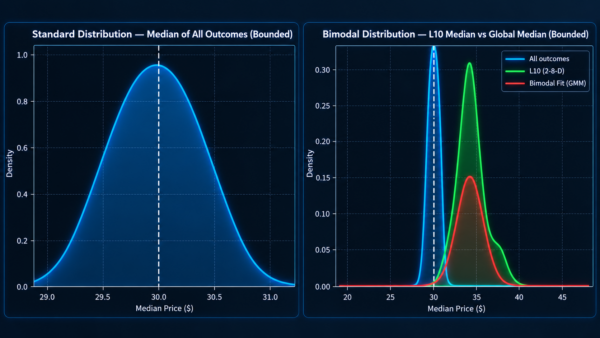
In the case of ONON stock and the aforementioned bull spread, the low probabilities stem from Black-Scholes, which itself presupposes that the target security undergoes a random walk between now and the selected expiration date, with the current implied volatility (IV) serving as a constant throughout the journey.
onon - StockEarnings

So yes, if you believe that On Holding stock will trade in a random, risk-neutral environment, the probabilities mentioned above — 28% to break even, 18.26% to full profitability — are valid. They reflect the math of randomness.

However, the meta question you should be asking is: will ONON stock truly trade randomly?

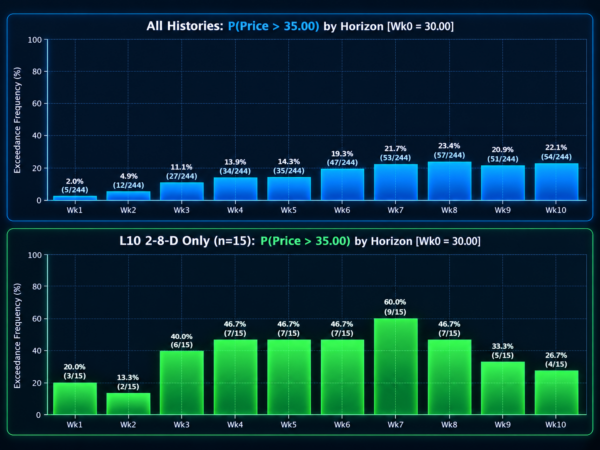
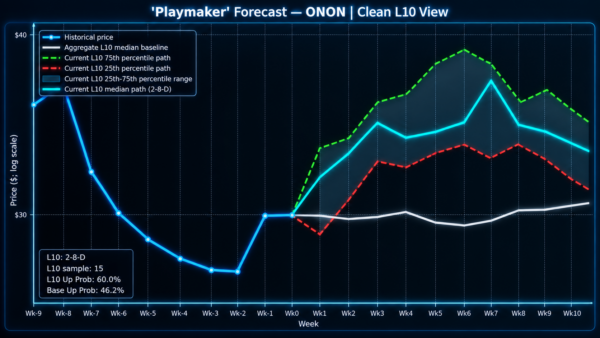
I don’t think it will. If we consider rolling 10-week sequences of ONON’s price history as individual Markov states, then we can say that the current state is an incredibly bearish one. In the last 10 weeks, we know that On Holding stock has only managed to print three up weeks, thereby leading to a downward slope.
onon - StockEarnings

We also know that under such extremely pessimistic Markov states, ONON stock tends to transition to a higher plateau. If we were to juxtapose the median expected performance to the current share price, we may calculate a probability between 46.7% and 60% that the ticker will hit $35 on or around Nov. 20.

Caveats to Consider Before Taking the Leap

If the Markov probabilities turn out to be accurate, they would arguably make the 32.50/35 bull spread far more enticing. Suddenly, the same trade that suffered from negative expectancy would enjoy positive expectancy — all thanks to a shift in presuppositions.

Of course, the counterargument is asking whether the Markov presupposition is better suited for ONON stock.

I have to be honest, I simply don’t know. But the reason I prefer Markov chains rather than a straight random walk is that I don’t see any evidence that the price discovery process is random. To me, it is clear as daylight that the future is dependent on the past, not independent as Black-Scholes presupposes.

To be fair, the Markov framework for On Holding stock is extremely risky because of the low sample size problem. With the ticker IPO’ing in 2021, the data pool is unfortunately limited. Still, what we can infer is that, from the dataset that is available, the current bearish Markov state tends to yield positive results for risk-tolerant speculators.


Joshua Enomoto is a seasoned financial writer with a strong track record of in-depth stock analysis, offering clear, insightful commentary for retail investors across all levels of expertise. Renowned for his ability to blend analytical rigor with engaging wit, Joshua's work has been featured on leading investment platforms, including TipRanks, InvestorPlace, Barchart, Benzinga, and Fintel. He was also handpicked to spearhead high-impact initiatives such as InvestorPlace's "Trade of the Day" and Benzinga’s ETF coverage. As a frequent guest expert for CGTN America, Joshua discusses a wide range of economic, societal, and consumer market trends. A graduate of U.C. San Diego, Joshua brings a thoughtful and fresh perspective to complex financial narratives, helping enterprise clients connect with their audiences. He also composes music in his spare time.

Join over 1.2M+ investors/traders who receive daily and weekly notable earnings alerts with predicted move