ajax loader

Loading...


Ride-the-Wave Strategy – Best for Stock Traders

Ride-the-Wave targets multi-day price momentum following a company’s earnings announcement (EA). With this strategy:

  1. Buy a stock one day post-EA if a stock reacts positively post-earnings:
    1. Near the close of trading the EA-day for a pre-market-EA
    2. Near the close of the following day for a post-market-EA
  2. Sell-to-close after 7-10 days, or possibly earlier if a desired price target is reached

Similarly,

  1. short a stock one day post-EA if a stock reacts negatively post-earnings:
    1. near the close of trading the EA-day for a premarket-EA
    2. near the close of the following day for a post-market-EA
  2. then buy-to-close after 7-10 days, or possibly earlier if a desired price target is reached

Important: Ride-the-Wave is predicated on significant price momentum triggered by an EA. The 7-10 day scenario is the maximum trade hold-time. If you see post EA-momentum is halted or reversed by a significant opposite move, re-evaluate your presence in the trade.

This popular StockEarnings screen below will give you a list of stocks that historically exhibit significant price momentum following an EA for the next seven days:

  1. Stocks exhibiting positive post-EA price moves are buy-candidates
  2. Stocks exhibiting negative post-EA price moves are sell/short-candidates

The screen includes those stocks whose Earnings just came out in last two days.

Screen criteria:

  1. Earnings Date Start Date : Current Date + -1 Day
  2. Earnings Date End Date : Current Date + -2 Days
  3. Predicted Move (Next Day) Max : 7%
  4. Predicted Move (On 7th Day) Min : 7%

Strategy Guideline:

  1. Buy the stock if stock has reacted positively. Short the stock if stock has reacted negatively (see above).
  2. Close the position in 7-10 days, or possibly earlier based on price move.

Volatility Crush Strategy - Best for Options Traders

The Volatility Crush strategy is used with stocks that typically experience relatively low-to-moderate price moves (≤4%) following their Earnings Announcements (EA). The basic trade idea is to sell put or call options right before the EA, collecting a credit when options premium is very high due to elevated implied volatility (IV). You then close the position right after the EA by buying the option back much cheaper due to the significant drop in IV that occurs after the mystery of the EA disappears. In assessing this trade, you need to do your homework to ensure you collect sufficient premium to make the trade worthwhile.

This trade is practical due to the low-to-moderate price-move after the EA, which generally won’t significantly affect the options price, unlike an “action” stock, which experience great price moves post-EA. With these symbols, if you’re on the right side of the price move, that’s a great thing. But if you’re on the wrong side of the move, not so great. Consequently, by minimizing the effect of the post-EA price move, you have a much better chance to profit from the reduction in IV without it being ruined by a violent price move.

For this trade, open the position either (1) the night before the EA when the company announces earnings or (2) during the EA day when it announces post-market, generally capturing IV at or close to its peak.

For this trade, open the position either (1) the night before the EA when the company announces earnings or (2) during the EA day when it announces post-market, generally capturing IV at or close to its peak.

This popular stockearnings screen will give you a list of stocks which do not react more than 4% fpost-EA. It includes only those stocks whose earnings are releasing next day.

Screen criteria:

  1. Earnings Date Start Date : Current Date + 1
  2. Earnings Date End Date : Current Date + 1
  3. Predicted Move (Next Day) Max : 4%
  4. Options Type: Weekly

Strategy Guideline:

  1. Options Strategy: Sell Call and Put
  2. Options Strike Price: Current Stock Price – (% Predicated Move x 2)
  3. Expiration Date: It should generally be the closest expiry immediately after the EA.
  4. Buy Insurance: Buying back Call and Put at Strike price which 10% lower than Sell Strike Price is optional but recommended.

Watch Video for More Detail

Volatility Rush Strategy - Best for Options Traders

The Volatility Rush takes advantage of increasing options premiums into earnings announcements (EA) caused by an anticipated rise in Implied Volatility (IV). With this strategy, Buy a Call and Put at-the-money (a long straddle) 2-3 weeks before the EA when IV is lower. Sell the position either (1) the night before the EA when the company announces earnings pre-market, or (2) during the EA day when it announces post-market, generally capturing IV at or close to its peak.

This popular screen will give you a list of stocks whose Options premiums tend to rise into Earnings. It includes only those stocks whose Earnings are at least two weeks away from today.

Screen criteria:

  1. Earnings Date Start Date : Current Date + 15 Days
  2. Earnings Date End Date : Current Date + 30 Days
  3. Predicted Move (Next Day) Min : 5%
  4. Options Type: Weekly or Monthly if that lines up with the two to three-week lead-time for entering the trade

Strategy Guideline:

  1. Buy a Straddle at or close to the money two to three weeks pre-EA.
  2. Sell the position either the night before the EA when the company announces earnings pre-market, or during the EA day when it announces post-market.
  3. Expiration date should generally be the closest expiry immediately after the EA.
  4. Straddle price should not be more 60% of predicted move.

Predicted Move (Volatility)

Similar to Implied Volatility in Options. Expected volatility % based on our Proprietary Volatility Predication Model. We are expecting that stock price will likely to reach % in either direction by the end of next trading session after Earnings are released and not necessarily the closing volatility %.

Why is it important?

    This indicator helps

  1. Knowing expected volatility in stocks after Earnings helps to decide trading stocks before Earnings Announcement.
  2. Taking Advantage of volatility collapse following Earnings Results by using Advance Options strategies such as Spread and Straddles.

Since Last Earnings

Change in share price since last Earnings release.

Why is it Important?

When share has gained more than 10% since it's last Earning release, it tends to over react to minor bad news and give up some gains if not all. So, it contains more downside volatility than upside When share has dropped more than 10% since it's last Earning release, it tends to over react to minor good news and recover some drops if not all. So, it contains more upside volatility than downside.

EPS Surprise (%)

Occurs when a company's reported quarterly or annual profits are above or below analysts' expectations. Here is the formula to derive % EPS Surprice:

Actual EPS - Estimated EPS
------------------------------------- x 100
Estimated EPS

Why is it Important?

Earnings surprises can have a huge impact on a company's stock price. Several studies suggest that positive earnings surprises not only lead to an immediate hike in a stock's price, but also to a gradual increase over time. Hence, it's not surprising that some companies are known for routinely beating earning projections. A negative earnings surprise will usually result in a decline in share price.

Next Day Price Change (%)

Next Regular trading session Closing price following Earnings result.

For After Market Close Earnings, It is a next trading day closing price. For Before Market Open Earnings, It is the same trading day closing price.

Why is it Important?

Next Day price change is a reaction of Earnings result.

Public Storage’s Growth Problem Is Hiding Inside Its Acquisition Boom

Posted on Oct 27, 2026 by Grayson Cavern

Public Storage’s Growth Problem Is Hiding Inside Its Acquisition Boom

Public Storage (NYSE: PSA) raised its 2026 earnings outlook after reporting $4.34 in third-quarter Core Funds From Operations (Core FFO) per share, up just 0.7% from a year ago. The self-storage giant has spent much of 2026 expanding its footprint, completing acquisitions of National Storage Affiliates and Public Storage Canada while positioning its operating platform to extract more value from those properties. The strategy gives Public Storage a larger business and a new source of growth. However, its established facilities are telling a much quieter story.

Same-store revenue and net operating income (NOI) each grew just 0.5% in the third quarter, and management increased its full-year Core FFO guidance by only $0.10 at the midpoint. Public Storage is adding scale faster than its existing portfolio is generating organic growth, making the success of its acquisition strategy central to the investment thesis. The next phase depends on whether the company can turn those new properties into stronger earnings per share.

Public Storage’s Existing Business Is Barely Growing


The company generated $1.022 billion in same-store revenue during the third quarter, compared with $1.017 billion a year earlier. Same-store NOI reached $768.8 million, a 0.5% increase, while average occupancy improved from 91.9% to 92.2%. The operating picture is gradually improving, but the gains remain small for a business whose growth story increasingly depends on extracting more income from its real estate portfolio.

The pressure becomes clearer when expenses enter the picture. Direct operating costs increased 2% year over year, outpacing revenue growth, with repairs and maintenance expenses rising 17.4% and marketing costs climbing 12.5%. Lower indirect costs helped offset those increases, allowing NOI to edge higher, but the underlying portfolio has little room for error if expenses continue growing faster than revenue.

Management pointed to lower customer churn, higher occupancy and stronger move-in rates as encouraging trends. Those improvements helped the quarter come in ahead of expectations and supported the higher annual outlook. Yet Public Storage’s revised forecast still calls for same-store revenue growth of just 0%–0.5% and NOI growth ranging from a 0.8% decline to 0.2%.

That leaves the acquisitions carrying much of the growth burden.

The Acquisitions Need to Deliver More Than Scale

Public Storage’s non-same-store portfolio offers a sharp contrast. Revenue and NOI from these facilities grew 90.8% and 91.8%, respectively, during the quarter. This group includes acquired properties, newer developments, and facilities still progressing through lease-up, so its growth reflects the expansion and changing composition of the portfolio rather than a comparable surge across established locations.

The company completed its National Storage Affiliates acquisition in July and acquired Public Storage Canada in September for approximately $1.2 billion, including assumed debt. At September 30, Public Storage owned or operated 4,764 facilities with approximately 339 million net rentable square feet. Management expects the NSA acquisition to generate $110 million to $130 million in annualized synergies within three to four years through improved customer experience, higher NOI, tenant reinsurance, and general and administrative savings.

That synergy target is the key to the expansion thesis. Public Storage already has the additional properties; the financial payoff depends on integrating them and improving their performance. If the company can apply its PS Next operating platform successfully, acquisitions could become a more durable source of earnings growth. Until then, a larger footprint alone tells investors little about how quickly returns per share will improve.

Higher Guidance Has a Modest Earnings Upgrade Behind It

Now the full-year Core FFO guidance was raised to $16.90–$17.10 per share, increasing the midpoint by $0.10. It also improved its same-store NOI outlook by 90 basis points, reflecting better year-to-date performance and improving operating trends. The revision signals greater confidence in the business, but the limited increase in per-share guidance puts the focus squarely on how much additional value the expanded portfolio can generate.

GAAP earnings look considerably weaker. Net income per diluted share fell 35.5%, from $2.62 to $1.69, while transaction and integration expenses reached $114.6 million. Higher depreciation and amortization following the acquisitions also weighed on reported results. Core FFO excludes certain items, including acquisition-related expenses, and therefore offers a more useful view of recurring performance for this REIT. Even on that measure, however, quarterly growth was minimal.

Financing adds another consideration. Public Storage ended the quarter with $12.2 billion in total debt, while its weighted-average interest rate rose from 3.0% to 3.6% year over year. Net debt to EBITDA increased from 3.0x to 3.4x. The company reported approximately $4.1 billion in liquidity, but successful integration and stronger property-level earnings matter more as the balance sheet absorbs an expanded portfolio.

PSA Needs to Break $310

Public Storage closed October 26 at $306.97, with after-hours trading at $309. The shares have recovered above their 20-day moving average near $292, 50-day average around $299, and 200-day average near $302, putting the stock in a stronger position than it was during the September–October decline.

The immediate test is $310, close to the session high of $310.68. A sustained move above that level would strengthen the recovery and put $320 back in view. A drop below the $300–$302 area would weaken the setup and risk undoing part of the rebound.
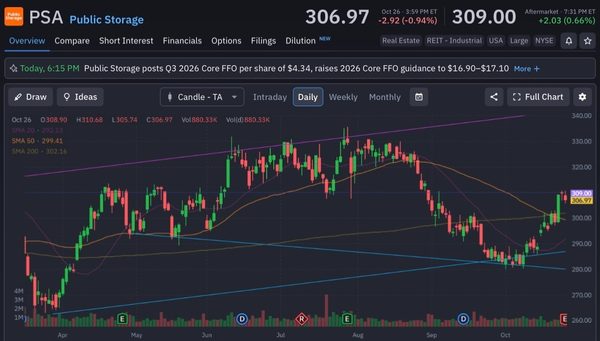
public storage - StockEarnings

Public Storage has expanded its footprint and raised its outlook, but the next leg of its growth story depends on what those acquisitions deliver. For investors, the number to watch is not simply how many facilities PSA owns, but whether that larger portfolio can finally produce faster Core FFO growth per share.


Join over 1.2M+ investors/traders who receive daily and weekly notable earnings alerts with predicted move