ajax loader

Loading...


Ride-the-Wave Strategy – Best for Stock Traders

Ride-the-Wave targets multi-day price momentum following a company’s earnings announcement (EA). With this strategy:

  1. Buy a stock one day post-EA if a stock reacts positively post-earnings:
    1. Near the close of trading the EA-day for a pre-market-EA
    2. Near the close of the following day for a post-market-EA
  2. Sell-to-close after 7-10 days, or possibly earlier if a desired price target is reached

Similarly,

  1. short a stock one day post-EA if a stock reacts negatively post-earnings:
    1. near the close of trading the EA-day for a premarket-EA
    2. near the close of the following day for a post-market-EA
  2. then buy-to-close after 7-10 days, or possibly earlier if a desired price target is reached

Important: Ride-the-Wave is predicated on significant price momentum triggered by an EA. The 7-10 day scenario is the maximum trade hold-time. If you see post EA-momentum is halted or reversed by a significant opposite move, re-evaluate your presence in the trade.

This popular StockEarnings screen below will give you a list of stocks that historically exhibit significant price momentum following an EA for the next seven days:

  1. Stocks exhibiting positive post-EA price moves are buy-candidates
  2. Stocks exhibiting negative post-EA price moves are sell/short-candidates

The screen includes those stocks whose Earnings just came out in last two days.

Screen criteria:

  1. Earnings Date Start Date : Current Date + -1 Day
  2. Earnings Date End Date : Current Date + -2 Days
  3. Predicted Move (Next Day) Max : 7%
  4. Predicted Move (On 7th Day) Min : 7%

Strategy Guideline:

  1. Buy the stock if stock has reacted positively. Short the stock if stock has reacted negatively (see above).
  2. Close the position in 7-10 days, or possibly earlier based on price move.

Volatility Crush Strategy - Best for Options Traders

The Volatility Crush strategy is used with stocks that typically experience relatively low-to-moderate price moves (≤4%) following their Earnings Announcements (EA). The basic trade idea is to sell put or call options right before the EA, collecting a credit when options premium is very high due to elevated implied volatility (IV). You then close the position right after the EA by buying the option back much cheaper due to the significant drop in IV that occurs after the mystery of the EA disappears. In assessing this trade, you need to do your homework to ensure you collect sufficient premium to make the trade worthwhile.

This trade is practical due to the low-to-moderate price-move after the EA, which generally won’t significantly affect the options price, unlike an “action” stock, which experience great price moves post-EA. With these symbols, if you’re on the right side of the price move, that’s a great thing. But if you’re on the wrong side of the move, not so great. Consequently, by minimizing the effect of the post-EA price move, you have a much better chance to profit from the reduction in IV without it being ruined by a violent price move.

For this trade, open the position either (1) the night before the EA when the company announces earnings or (2) during the EA day when it announces post-market, generally capturing IV at or close to its peak.

For this trade, open the position either (1) the night before the EA when the company announces earnings or (2) during the EA day when it announces post-market, generally capturing IV at or close to its peak.

This popular stockearnings screen will give you a list of stocks which do not react more than 4% fpost-EA. It includes only those stocks whose earnings are releasing next day.

Screen criteria:

  1. Earnings Date Start Date : Current Date + 1
  2. Earnings Date End Date : Current Date + 1
  3. Predicted Move (Next Day) Max : 4%
  4. Options Type: Weekly

Strategy Guideline:

  1. Options Strategy: Sell Call and Put
  2. Options Strike Price: Current Stock Price – (% Predicated Move x 2)
  3. Expiration Date: It should generally be the closest expiry immediately after the EA.
  4. Buy Insurance: Buying back Call and Put at Strike price which 10% lower than Sell Strike Price is optional but recommended.

Watch Video for More Detail

Volatility Rush Strategy - Best for Options Traders

The Volatility Rush takes advantage of increasing options premiums into earnings announcements (EA) caused by an anticipated rise in Implied Volatility (IV). With this strategy, Buy a Call and Put at-the-money (a long straddle) 2-3 weeks before the EA when IV is lower. Sell the position either (1) the night before the EA when the company announces earnings pre-market, or (2) during the EA day when it announces post-market, generally capturing IV at or close to its peak.

This popular screen will give you a list of stocks whose Options premiums tend to rise into Earnings. It includes only those stocks whose Earnings are at least two weeks away from today.

Screen criteria:

  1. Earnings Date Start Date : Current Date + 15 Days
  2. Earnings Date End Date : Current Date + 30 Days
  3. Predicted Move (Next Day) Min : 5%
  4. Options Type: Weekly or Monthly if that lines up with the two to three-week lead-time for entering the trade

Strategy Guideline:

  1. Buy a Straddle at or close to the money two to three weeks pre-EA.
  2. Sell the position either the night before the EA when the company announces earnings pre-market, or during the EA day when it announces post-market.
  3. Expiration date should generally be the closest expiry immediately after the EA.
  4. Straddle price should not be more 60% of predicted move.

Predicted Move (Volatility)

Similar to Implied Volatility in Options. Expected volatility % based on our Proprietary Volatility Predication Model. We are expecting that stock price will likely to reach % in either direction by the end of next trading session after Earnings are released and not necessarily the closing volatility %.

Why is it important?

    This indicator helps

  1. Knowing expected volatility in stocks after Earnings helps to decide trading stocks before Earnings Announcement.
  2. Taking Advantage of volatility collapse following Earnings Results by using Advance Options strategies such as Spread and Straddles.

Since Last Earnings

Change in share price since last Earnings release.

Why is it Important?

When share has gained more than 10% since it's last Earning release, it tends to over react to minor bad news and give up some gains if not all. So, it contains more downside volatility than upside When share has dropped more than 10% since it's last Earning release, it tends to over react to minor good news and recover some drops if not all. So, it contains more upside volatility than downside.

EPS Surprise (%)

Occurs when a company's reported quarterly or annual profits are above or below analysts' expectations. Here is the formula to derive % EPS Surprice:

Actual EPS - Estimated EPS
------------------------------------- x 100
Estimated EPS

Why is it Important?

Earnings surprises can have a huge impact on a company's stock price. Several studies suggest that positive earnings surprises not only lead to an immediate hike in a stock's price, but also to a gradual increase over time. Hence, it's not surprising that some companies are known for routinely beating earning projections. A negative earnings surprise will usually result in a decline in share price.

Next Day Price Change (%)

Next Regular trading session Closing price following Earnings result.

For After Market Close Earnings, It is a next trading day closing price. For Before Market Open Earnings, It is the same trading day closing price.

Why is it Important?

Next Day price change is a reaction of Earnings result.

Cadence’s AI Boom Is Growing Revenue Faster Than Profits

Posted on Oct 27, 2026 by Grayson Cavern

Cadence’s AI Boom Is Growing Revenue Faster Than Profits

Cadence Design Systems (NASDAQ: CDNS) grew third-quarter revenue 22% year over year to $1.63 billion, raised its full-year outlook for the third time this year, and reported a record $8.2 billion backlog. The AI infrastructure buildout is driving demand for the software engineers use to design, verify, and simulate increasingly complex chips and computing systems, and Cadence is capturing that demand across its core businesses.

However, revenue growth has outpaced profit growth. GAAP earnings per share remained flat at $1.05, while GAAP operating margin fell from 31.8% to 26.2%. Cadence is selling more of the tools needed to build the AI economy, but rising costs are absorbing much of the additional revenue. Its backlog and higher guidance support the growth thesis; the next test is whether that momentum can translate into stronger earnings.

AI Demand Is Lifting Cadence’s Core Business


Cadence’s strongest evidence of AI-driven demand is the breadth of growth across its established product lines. Core electronic design automation (EDA) revenue increased 20% year over year, semiconductor intellectual property revenue climbed 24%, and system design and analysis revenue rose 30%. All three businesses delivered double-digit growth in the third quarter.

Core EDA accounted for 69% of quarterly revenue, making it Cadence’s primary growth engine. As chipmakers and systems companies develop increasingly complex AI infrastructure, they need tools to design and verify semiconductors, analyze systems, and test performance before production. That creates demand across Cadence’s existing portfolio, allowing the company to benefit from AI investment without relying on a single new product.

Customer deployments illustrate how Cadence is helping engineers work more efficiently. MediaTek deployed Cadence’s ChipStack technology in production digital verification, with reported improvements of 50%–70% in verification coverage and a 1.4–2x reduction in engineering effort. Renesas deployed InnoStack across engineering tasks, with a reported 34x productivity improvement for its microcontroller team. Nokia is deploying AuraStack on its Millennium Supercomputer, with reported acceleration of up to 5x in key design and analysis workflows.

Cadence is expanding this opportunity through Maestro, its portfolio of specialized AI models, and AI Super Agents, which have more than 100 active customer engagements. Initial Maestro results reportedly show up to 30% higher quality and five times greater token efficiency than general-purpose foundation models. These products could deepen Cadence’s position, although its established businesses remain the clearest evidence of AI-related growth today.

The $8.2 Billion Backlog Supports Higher Guidance

Cadence’s record $8.2 billion backlog strengthens the case for continued expansion. The company reported $7.8 billion at the end of 2025, while $4.2 billion of revenue is expected to be recognized over the next 12 months from remaining performance obligations. That provides visibility into a substantial portion of near-term business.

Management now expects full-year 2026 revenue of $6.387 billion to $6.417 billion, implying approximately 21% year-over-year growth. Its previous forecast called for $6.260 billion to $6.340 billion. The midpoint of its non-GAAP EPS outlook also increased from $8.10 to $8.40.

For the fourth quarter, Cadence expects revenue of $1.695 billion to $1.725 billion, representing 18%–20% year-over-year growth, with non-GAAP EPS of $2.19–$2.25. The third increase to its annual outlook this year reinforces the case that demand has remained stronger than management previously anticipated.

The backlog connects Cadence’s AI opportunity to future revenue, while double-digit growth across all three product groups shows that expansion is broad-based. Customer demand and export restrictions remain risks, but Cadence enters the final quarter with a larger business base and a higher growth target.

Rising Costs Are Eating Into the AI Windfall

Despite its revenue gains, Cadence has yet to deliver comparable growth in GAAP profitability. Quarterly revenue rose from $1.34 billion to $1.63 billion, but GAAP operating income increased only slightly, from approximately $425 million to $429 million. GAAP net income edged up from $287 million to $290 million, leaving diluted GAAP EPS unchanged at $1.05.

Research and development spending rose from $423 million to $538 million, acquired-intangible amortization increased from approximately $10 million to $34 million, and restructuring expenses climbed from $27 million to $42 million. Total GAAP costs and expenses reached approximately $1.21 billion, versus $913 million a year earlier.

Non-GAAP diluted EPS rose 9% to $2.11, but non-GAAP operating margin narrowed from 47.6% to 44.1%. Cadence is growing, yet a smaller share of each revenue dollar is reaching operating profit. Its investments may support future expansion, but shareholders need those investments to produce stronger earnings over time.

Cash generation improved: operating cash flow increased 36% to $424 million, and free cash flow rose 31% to $362 million. Cadence also repurchased $400 million of stock and authorized an additional $2.5 billion buyback program. Those repurchases can support per-share results, but sustained earnings growth ultimately requires better operating leverage.

CDNS Needs $335 to Put Bulls in Control

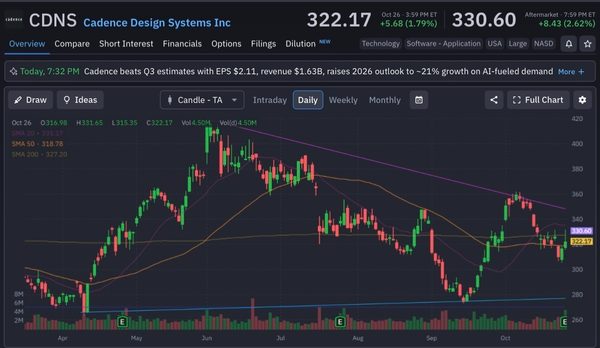
Cadence closed October 26 at $322.17, above its 50-day moving average near $318.78 but below its 200-day average around $327.20 and 20-day average near $335.17. The stock has recovered from its September lows but remains below key resistance.

The $327–$335 zone is the immediate test. Reclaiming the 200-day average and breaking above $335 would strengthen the recovery and give buyers a clearer technical signal. Rejection would leave the stock vulnerable to a pullback toward $319.
cadence - StockEarnings

Cadence has the backlog and growth forecast to support its AI thesis. For CDNS shares to build on that momentum, buyers need to clear $335, while upcoming results show profit growth catching up with revenue.


Join over 1.2M+ investors/traders who receive daily and weekly notable earnings alerts with predicted move