ajax loader

Loading...


Ride-the-Wave Strategy – Best for Stock Traders

Ride-the-Wave targets multi-day price momentum following a company’s earnings announcement (EA). With this strategy:

  1. Buy a stock one day post-EA if a stock reacts positively post-earnings:
    1. Near the close of trading the EA-day for a pre-market-EA
    2. Near the close of the following day for a post-market-EA
  2. Sell-to-close after 7-10 days, or possibly earlier if a desired price target is reached

Similarly,

  1. short a stock one day post-EA if a stock reacts negatively post-earnings:
    1. near the close of trading the EA-day for a premarket-EA
    2. near the close of the following day for a post-market-EA
  2. then buy-to-close after 7-10 days, or possibly earlier if a desired price target is reached

Important: Ride-the-Wave is predicated on significant price momentum triggered by an EA. The 7-10 day scenario is the maximum trade hold-time. If you see post EA-momentum is halted or reversed by a significant opposite move, re-evaluate your presence in the trade.

This popular StockEarnings screen below will give you a list of stocks that historically exhibit significant price momentum following an EA for the next seven days:

  1. Stocks exhibiting positive post-EA price moves are buy-candidates
  2. Stocks exhibiting negative post-EA price moves are sell/short-candidates

The screen includes those stocks whose Earnings just came out in last two days.

Screen criteria:

  1. Earnings Date Start Date : Current Date + -1 Day
  2. Earnings Date End Date : Current Date + -2 Days
  3. Predicted Move (Next Day) Max : 7%
  4. Predicted Move (On 7th Day) Min : 7%

Strategy Guideline:

  1. Buy the stock if stock has reacted positively. Short the stock if stock has reacted negatively (see above).
  2. Close the position in 7-10 days, or possibly earlier based on price move.

Volatility Crush Strategy - Best for Options Traders

The Volatility Crush strategy is used with stocks that typically experience relatively low-to-moderate price moves (≤4%) following their Earnings Announcements (EA). The basic trade idea is to sell put or call options right before the EA, collecting a credit when options premium is very high due to elevated implied volatility (IV). You then close the position right after the EA by buying the option back much cheaper due to the significant drop in IV that occurs after the mystery of the EA disappears. In assessing this trade, you need to do your homework to ensure you collect sufficient premium to make the trade worthwhile.

This trade is practical due to the low-to-moderate price-move after the EA, which generally won’t significantly affect the options price, unlike an “action” stock, which experience great price moves post-EA. With these symbols, if you’re on the right side of the price move, that’s a great thing. But if you’re on the wrong side of the move, not so great. Consequently, by minimizing the effect of the post-EA price move, you have a much better chance to profit from the reduction in IV without it being ruined by a violent price move.

For this trade, open the position either (1) the night before the EA when the company announces earnings or (2) during the EA day when it announces post-market, generally capturing IV at or close to its peak.

For this trade, open the position either (1) the night before the EA when the company announces earnings or (2) during the EA day when it announces post-market, generally capturing IV at or close to its peak.

This popular stockearnings screen will give you a list of stocks which do not react more than 4% fpost-EA. It includes only those stocks whose earnings are releasing next day.

Screen criteria:

  1. Earnings Date Start Date : Current Date + 1
  2. Earnings Date End Date : Current Date + 1
  3. Predicted Move (Next Day) Max : 4%
  4. Options Type: Weekly

Strategy Guideline:

  1. Options Strategy: Sell Call and Put
  2. Options Strike Price: Current Stock Price – (% Predicated Move x 2)
  3. Expiration Date: It should generally be the closest expiry immediately after the EA.
  4. Buy Insurance: Buying back Call and Put at Strike price which 10% lower than Sell Strike Price is optional but recommended.

Watch Video for More Detail

Volatility Rush Strategy - Best for Options Traders

The Volatility Rush takes advantage of increasing options premiums into earnings announcements (EA) caused by an anticipated rise in Implied Volatility (IV). With this strategy, Buy a Call and Put at-the-money (a long straddle) 2-3 weeks before the EA when IV is lower. Sell the position either (1) the night before the EA when the company announces earnings pre-market, or (2) during the EA day when it announces post-market, generally capturing IV at or close to its peak.

This popular screen will give you a list of stocks whose Options premiums tend to rise into Earnings. It includes only those stocks whose Earnings are at least two weeks away from today.

Screen criteria:

  1. Earnings Date Start Date : Current Date + 15 Days
  2. Earnings Date End Date : Current Date + 30 Days
  3. Predicted Move (Next Day) Min : 5%
  4. Options Type: Weekly or Monthly if that lines up with the two to three-week lead-time for entering the trade

Strategy Guideline:

  1. Buy a Straddle at or close to the money two to three weeks pre-EA.
  2. Sell the position either the night before the EA when the company announces earnings pre-market, or during the EA day when it announces post-market.
  3. Expiration date should generally be the closest expiry immediately after the EA.
  4. Straddle price should not be more 60% of predicted move.

Predicted Move (Volatility)

Similar to Implied Volatility in Options. Expected volatility % based on our Proprietary Volatility Predication Model. We are expecting that stock price will likely to reach % in either direction by the end of next trading session after Earnings are released and not necessarily the closing volatility %.

Why is it important?

    This indicator helps

  1. Knowing expected volatility in stocks after Earnings helps to decide trading stocks before Earnings Announcement.
  2. Taking Advantage of volatility collapse following Earnings Results by using Advance Options strategies such as Spread and Straddles.

Since Last Earnings

Change in share price since last Earnings release.

Why is it Important?

When share has gained more than 10% since it's last Earning release, it tends to over react to minor bad news and give up some gains if not all. So, it contains more downside volatility than upside When share has dropped more than 10% since it's last Earning release, it tends to over react to minor good news and recover some drops if not all. So, it contains more upside volatility than downside.

EPS Surprise (%)

Occurs when a company's reported quarterly or annual profits are above or below analysts' expectations. Here is the formula to derive % EPS Surprice:

Actual EPS - Estimated EPS
------------------------------------- x 100
Estimated EPS

Why is it Important?

Earnings surprises can have a huge impact on a company's stock price. Several studies suggest that positive earnings surprises not only lead to an immediate hike in a stock's price, but also to a gradual increase over time. Hence, it's not surprising that some companies are known for routinely beating earning projections. A negative earnings surprise will usually result in a decline in share price.

Next Day Price Change (%)

Next Regular trading session Closing price following Earnings result.

For After Market Close Earnings, It is a next trading day closing price. For Before Market Open Earnings, It is the same trading day closing price.

Why is it Important?

Next Day price change is a reaction of Earnings result.

With Palantir (PLTR) Stock Down 36% YTD, Is Now a Good Time to Buy?

Posted on Jun 26, 2026 by Joshua Enomoto

With Palantir (PLTR) Stock Down 36% YTD, Is Now a Good Time to Buy?

Ranking among the most powerful but controversial firms, Palantir Technologies (NASDAQ: PLTR) is no stranger to the limelight. Since 2024, PLTR stock has skyrocketed to unbelievable heights, with the underlying big-data analytics core securing lucrative government and commercial contracts. However, the equity has also suffered badly in recent sessions, leading to a sizable decline.

How large is the crimson wave? Since the start of the year, PLTR stock is down a bit more than 36%. In the past 52 weeks, shareholders have lost nearly 21% of market value. As multiple publications have pointed out, Palantir has incurred significant technical damage — which does raise the prospect of a contrarian trade.

So, the question lingers: is PLTR stock an upside opportunity right now?

It’s possible but I think we need to be mathematically honest about the risk associated with Palantir stock. Right now, there are three big assumptions regarding the bullish case for PLTR, which is as follows:

  • Palantir’s core business will continue to be fundamentally sound.
  • PLTR’s big decline will attract discount-seeking buyers.
  • Weaker-handed investors will continue to maintain their stake.

For those who are optimistic about Palantir’s sustained relevance, I imagine they may assign a 95% confidence level on this one factor. However, the bigger problem is the technical issues presented in bullet points two and three. Because of the sharp decline in PLTR stock, the confidence level would be around 60% each, if we’re being super-generous.

Where does that leave us? The compounded probability that all three factors will turn true simultaneously is only 36% (0.95 x 0.6 x 0.6 = 0.36). That’s why fundamental analysis toward a volatile name like Palantir represents a massive challenge. After all, the equities market is a non-deterministic system. In other words, the answer to the problem will only materialize sometime in the future. As such, the assumptions undergirding a forward-looking analysis is multiplicative, not additive.

Laying Down a Rational Framework for PLTR Stock


While some experts may build a case for buying PLTR stock right now, this thinking process is flawed because of the underlying volatility. You can only really build a case when the event in question has occurred in the past, such as a criminal trial. In this situation, the crime has actually happened. Therefore, any evidence forwarded helps to narrow the probability space of how the crime occurred.

But when it comes to the equities market, the event hasn’t happened yet. Therefore, analysts aren’t adding evidence but introducing assumptions. And these assumptions must turn out true in the proper sequence for the expected result to materialize as forecasted. Essentially, true equities analysis doesn’t involve building a case but minimizing confidence degradation.

When forecasting a blue-chip giant, the core assumptions inherently carry high confidence. As such, the compounded probability that the investment will provide a net positive return remains robust. Unfortunately, a volatile entity like PLTR stock lacks a high confidence level in at least one major assumption. Subsequently, this lack of confidence degrades the compounded probability of the event being forecasted.

How do we get around this problem? Rather than trying to predict a specific outcome, we can observe the underlying structures that lead to certain results.

For example, Amazon (NASDAQ:AMZN) doesn’t attempt to predict what you will buy next. Instead, it looks at dynamic structures that incentivize certain purchases — such as stocking up on umbrellas as a thunderstorm approaches. What Amazon has discovered is that as conditions change, consumer behaviors also change. Getting ahead of this shift allows the e-commerce giant to streamline its logistics.

We can apply the same principle with Palantir stock. There should be a noticeable difference between trading PLTR randomly versus waiting for a specific signal, such as coming off a series of bearish sessions.

Being Deliberate with Palantir Stock

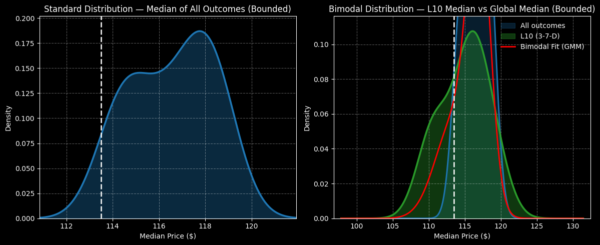
Let’s take a closer look at the performance odds of PLTR stock. If you bought shares randomly and held them for a 10-week period, you would be looking at a solidly positive return, with an expected forward distribution between $110 and $122 (assuming a starting price of $113.50, Wednesday’s close). Further, probability density would likely peak at around $118.

palantir-StockEarnings

Essentially, you stand a decent chance of generating a nearly 4% return. That’s not going to move the needle if you’re only buying a few shares. However, with the leverage of options, that possible 4% pop may translate into a robust reward.

However, the question now is, would buying Palantir stock today be worthwhile? The answer would only be “yes” if there is a positive incentive to buy PLTR relative to the random baseline. In the last 10 weeks, PLTR printed only three up weeks, leading to an overall downward slope. Therefore, this 3-7-D signal must deliver better results than the random guesser.

But when we analyze PLTR stock when coming off a 3-7-D, the forward 10-week distribution isn’t particularly great, with an expected range between $105 and $125. Yes, there’s more upside lying in the wings but the downside risk has also expanded unfavorably. Using the data at hand, Palantir is not the most welcoming contrarian opportunity.

Still, the wrinkle is that within the first three weeks of the 3-7-D signal flashing, PLTR stock has a tendency of swinging higher — potentially to around the $120 level. I made the same argument for Palantir back in May and sure enough, shares did enjoy a conspicuous pop before succumbing to choppiness.

Will lightning strike twice? Obviously, no one can answer that question because an inference is never logically necessary: PLTR stock can ultimately do whatever it wants. Nevertheless, if you believe in recurring patterns, I’d check out the 119/120 bull call spread expiring July 17.

As stated above, the history of PLTR stock coming off the 3-7-D signal shows it consistently reaching $120 on a median basis over the next three weeks. With a net debit of only $40 per spread and a maximum payout of 150% on tap, Palantir offers a tempting proposition — but only for the most risk-tolerant speculator.

For those who can’t handle the heat? You may want to sit this one out.

Joshua Enomoto is a seasoned financial writer with a strong track record of in-depth stock analysis, offering clear, insightful commentary for retail investors across all levels of expertise. Renowned for his ability to blend analytical rigor with engaging wit, Joshua's work has been featured on leading investment platforms, including TipRanks, InvestorPlace, Barchart, Benzinga, and Fintel. He was also handpicked to spearhead high-impact initiatives such as InvestorPlace's "Trade of the Day" and Benzinga’s ETF coverage. As a frequent guest expert for CGTN America, Joshua discusses a wide range of economic, societal, and consumer market trends. A graduate of U.C. San Diego, Joshua brings a thoughtful and fresh perspective to complex financial narratives, helping enterprise clients connect with their audiences. He also composes music in his spare time.

Join over 1.2M+ investors/traders who receive daily and weekly notable earnings alerts with predicted move