With market volatility, inflation concerns, and uncertainty surrounding interest rates continuing to keep investors on edge, investors are hunting for safer ways to generate consistent returns.
One strategy is to invest in high-quality dividend-paying stocks and dividend-focused exchange-traded funds (ETFs). Not only can dividend investments provide a steady stream of income, but they can also help cushion portfolios during market downturns.
If you’re looking for safety with yield to boot, it’s worth taking a closer look at the Dividend Aristocrats and Dividend Kings.
Why Dividend Aristocrats and Kings Matter
The Dividend Aristocrats represent some of the highest-quality companies in the market. To earn Aristocrat status, a company must have increased its dividend payout for at least 25 consecutive years. Dividend Kings take that distinction even further, consisting of companies that have raised their dividends for 50 years or more.
What makes these companies impressive is their ability to continue rewarding shareholders through virtually every economic environment imaginable. Whether facing inflation, recessions, rising interest rates, stock market crashes, geopolitical uncertainty, or economic booms and busts, these businesses have consistently found ways to grow their payouts.
If a company can survive decades of changing economic conditions while continuing to increase its dividend, it’s often worth putting on your investment radar.
Unfortunately, investors won’t currently find a dedicated Dividend King ETF. However, several ETFs provide exposure to high-quality companies and can help generate reliable income while reducing risk.
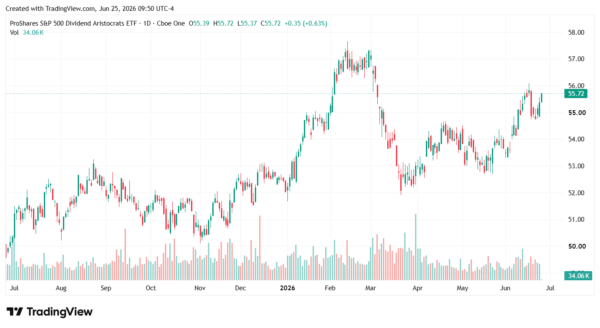
ProShares S&P 500 Dividend Aristocrats ETF
One of the most popular options is the ProShares S&P 500 Dividend Aristocrats ETF (BATS: NOBL). With an expense ratio of 0.35% and a yield of about 2.02%, NOBL focuses exclusively on companies within the S&P 500 that have increased dividends for at least 25 consecutive years.
A few of the fund’s top holdings include Caterpillar (NYSE: CAT), AbbVie (NYSE: ABBV), and Walmart (NASDAQ: WMT). Many of these companies have been rewarding investors with rising dividend payments for decades.
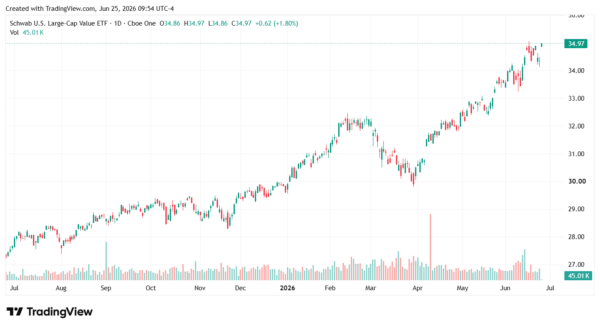
Schwab U.S. Large-Cap Value ETF
Another one to consider is the Schwab U.S. Large-Cap Value ETF (NYSEARCA: SCHV).
With a low expense ratio of just 0.04%, SCHV provides broad exposure to large-cap value stocks that often trade at attractive valuations compared to the broader market. The fund currently yields approximately 1.85%.
Its holdings include some of the most recognizable names in American business, including Johnson & Johnson (NYSE: JNJ), Exxon Mobil (NYSE:XOM), Home Depot (NYSE: HD), and AbbVie.
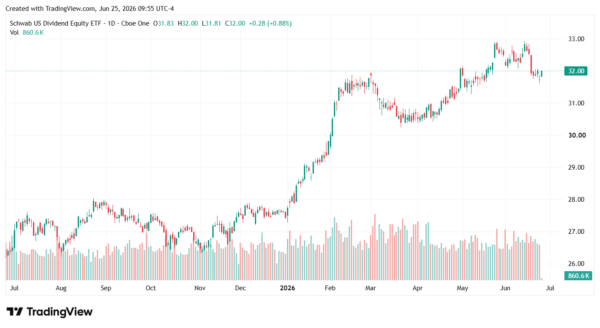
Schwab U.S. Dividend Equity ETF
For investors seeking a higher yield, the Schwab U.S. Dividend Equity ETF (NYSEARCA: SCHD) also stands out. With an expense ratio of just 0.06% and a yield of about 3.5%, SCHD has become a favorite among income-focused investors. The fund tracks the Dow Jones U.S. Dividend 100 Index and emphasizes companies with strong cash flow, sustainable dividends, and solid financial health. Top holdings include Amgen (NASDAQ: AMGN), AbbVie, Home Depot, and Coca-Cola (NASDAQ: COKE).
Why Dividend ETFs Work
Markets will always experience periods of uncertainty. Economic cycles come and go, interest rates rise and fall, and investor sentiment can shift quickly. However, companies that consistently generate profits and reward shareholders through growing dividends have historically proven to be among the market’s most dependable performers.
For investors seeking a combination of income, stability, and long-term wealth creation, dividend-focused ETFs such as NOBL, SCHV, and SCHD offer an easy way to gain exposure to some of the strongest businesses in America. While no investment is completely risk-free, owning a diversified basket of proven dividend growers can help smooth out market volatility while putting cash back into your pocket along the way.
