ajax loader

Loading...


Ride-the-Wave Strategy – Best for Stock Traders

Ride-the-Wave targets multi-day price momentum following a company’s earnings announcement (EA). With this strategy:

  1. Buy a stock one day post-EA if a stock reacts positively post-earnings:
    1. Near the close of trading the EA-day for a pre-market-EA
    2. Near the close of the following day for a post-market-EA
  2. Sell-to-close after 7-10 days, or possibly earlier if a desired price target is reached

Similarly,

  1. short a stock one day post-EA if a stock reacts negatively post-earnings:
    1. near the close of trading the EA-day for a premarket-EA
    2. near the close of the following day for a post-market-EA
  2. then buy-to-close after 7-10 days, or possibly earlier if a desired price target is reached

Important: Ride-the-Wave is predicated on significant price momentum triggered by an EA. The 7-10 day scenario is the maximum trade hold-time. If you see post EA-momentum is halted or reversed by a significant opposite move, re-evaluate your presence in the trade.

This popular StockEarnings screen below will give you a list of stocks that historically exhibit significant price momentum following an EA for the next seven days:

  1. Stocks exhibiting positive post-EA price moves are buy-candidates
  2. Stocks exhibiting negative post-EA price moves are sell/short-candidates

The screen includes those stocks whose Earnings just came out in last two days.

Screen criteria:

  1. Earnings Date Start Date : Current Date + -1 Day
  2. Earnings Date End Date : Current Date + -2 Days
  3. Predicted Move (Next Day) Max : 7%
  4. Predicted Move (On 7th Day) Min : 7%

Strategy Guideline:

  1. Buy the stock if stock has reacted positively. Short the stock if stock has reacted negatively (see above).
  2. Close the position in 7-10 days, or possibly earlier based on price move.

Volatility Crush Strategy - Best for Options Traders

The Volatility Crush strategy is used with stocks that typically experience relatively low-to-moderate price moves (≤4%) following their Earnings Announcements (EA). The basic trade idea is to sell put or call options right before the EA, collecting a credit when options premium is very high due to elevated implied volatility (IV). You then close the position right after the EA by buying the option back much cheaper due to the significant drop in IV that occurs after the mystery of the EA disappears. In assessing this trade, you need to do your homework to ensure you collect sufficient premium to make the trade worthwhile.

This trade is practical due to the low-to-moderate price-move after the EA, which generally won’t significantly affect the options price, unlike an “action” stock, which experience great price moves post-EA. With these symbols, if you’re on the right side of the price move, that’s a great thing. But if you’re on the wrong side of the move, not so great. Consequently, by minimizing the effect of the post-EA price move, you have a much better chance to profit from the reduction in IV without it being ruined by a violent price move.

For this trade, open the position either (1) the night before the EA when the company announces earnings or (2) during the EA day when it announces post-market, generally capturing IV at or close to its peak.

For this trade, open the position either (1) the night before the EA when the company announces earnings or (2) during the EA day when it announces post-market, generally capturing IV at or close to its peak.

This popular stockearnings screen will give you a list of stocks which do not react more than 4% fpost-EA. It includes only those stocks whose earnings are releasing next day.

Screen criteria:

  1. Earnings Date Start Date : Current Date + 1
  2. Earnings Date End Date : Current Date + 1
  3. Predicted Move (Next Day) Max : 4%
  4. Options Type: Weekly

Strategy Guideline:

  1. Options Strategy: Sell Call and Put
  2. Options Strike Price: Current Stock Price – (% Predicated Move x 2)
  3. Expiration Date: It should generally be the closest expiry immediately after the EA.
  4. Buy Insurance: Buying back Call and Put at Strike price which 10% lower than Sell Strike Price is optional but recommended.

Watch Video for More Detail

Volatility Rush Strategy - Best for Options Traders

The Volatility Rush takes advantage of increasing options premiums into earnings announcements (EA) caused by an anticipated rise in Implied Volatility (IV). With this strategy, Buy a Call and Put at-the-money (a long straddle) 2-3 weeks before the EA when IV is lower. Sell the position either (1) the night before the EA when the company announces earnings pre-market, or (2) during the EA day when it announces post-market, generally capturing IV at or close to its peak.

This popular screen will give you a list of stocks whose Options premiums tend to rise into Earnings. It includes only those stocks whose Earnings are at least two weeks away from today.

Screen criteria:

  1. Earnings Date Start Date : Current Date + 15 Days
  2. Earnings Date End Date : Current Date + 30 Days
  3. Predicted Move (Next Day) Min : 5%
  4. Options Type: Weekly or Monthly if that lines up with the two to three-week lead-time for entering the trade

Strategy Guideline:

  1. Buy a Straddle at or close to the money two to three weeks pre-EA.
  2. Sell the position either the night before the EA when the company announces earnings pre-market, or during the EA day when it announces post-market.
  3. Expiration date should generally be the closest expiry immediately after the EA.
  4. Straddle price should not be more 60% of predicted move.

Predicted Move (Volatility)

Similar to Implied Volatility in Options. Expected volatility % based on our Proprietary Volatility Predication Model. We are expecting that stock price will likely to reach % in either direction by the end of next trading session after Earnings are released and not necessarily the closing volatility %.

Why is it important?

    This indicator helps

  1. Knowing expected volatility in stocks after Earnings helps to decide trading stocks before Earnings Announcement.
  2. Taking Advantage of volatility collapse following Earnings Results by using Advance Options strategies such as Spread and Straddles.

Since Last Earnings

Change in share price since last Earnings release.

Why is it Important?

When share has gained more than 10% since it's last Earning release, it tends to over react to minor bad news and give up some gains if not all. So, it contains more downside volatility than upside When share has dropped more than 10% since it's last Earning release, it tends to over react to minor good news and recover some drops if not all. So, it contains more upside volatility than downside.

EPS Surprise (%)

Occurs when a company's reported quarterly or annual profits are above or below analysts' expectations. Here is the formula to derive % EPS Surprice:

Actual EPS - Estimated EPS
------------------------------------- x 100
Estimated EPS

Why is it Important?

Earnings surprises can have a huge impact on a company's stock price. Several studies suggest that positive earnings surprises not only lead to an immediate hike in a stock's price, but also to a gradual increase over time. Hence, it's not surprising that some companies are known for routinely beating earning projections. A negative earnings surprise will usually result in a decline in share price.

Next Day Price Change (%)

Next Regular trading session Closing price following Earnings result.

For After Market Close Earnings, It is a next trading day closing price. For Before Market Open Earnings, It is the same trading day closing price.

Why is it Important?

Next Day price change is a reaction of Earnings result.

Anthropic’s IPO May Be The Next Big Test For Oracle And AMD

Posted on Jun 24, 2026 by Grayson Cavern

Anthropic’s IPO May Be The Next Big Test For Oracle And AMD

Every AI boom rests on layers. One layer builds the tools. Another builds the models. A third turns those models into products customers actually pay for. Wall Street spent the last two years obsessed entirely with the first layer – chips, cloud infrastructure, data centers, power generation – and the trade worked spectacularly. Nvidia, AMD, Oracle, and a wave of infrastructure names became the market’s biggest winners simply by supplying the buildout.

Anthropic sits in the second layer. That’s why this IPO matters more than its size suggests.

The company hit a $61.5 billion valuation in its latest round, with annualized revenue reportedly approaching $3 billion and profitability finally entering the conversation. Anthropic itself isn’t the story here, it’s the catalyst. 

The real question is whether companies building large language models can generate revenue commensurate with the hundreds of billions flowing into the infrastructure built to serve them. Investors spent two years buying the suppliers without ever testing the demand side. Anthropic’s IPO hands them the first real chance to do exactly that, and Oracle and AMD sit directly in the blast radius of whatever answer the market delivers.

Oracle Bet $138 Billion On Demand That Hasn’t Arrived Yet


Last quarter, Oracle’s Remaining Performance Obligations hit $138 billion against fiscal 2026 revenue of $57.4 billion. That’s customer commitments running more than double a full year of revenue, with enterprises reserving cloud capacity years before they’ll actually need it. Cloud Infrastructure revenue climbed 52% year-over-year. OCI consumption grew 62%. Management is guiding OCI growth above 70% for fiscal 2027, and guidance at that level only makes sense if the people setting it believe the demand curve keeps climbing rather than flattening out.

Now, Oracle Corp (NYSE: ORCL) sits one layer beneath Anthropic in this stack. The models generate the headlines; Oracle’s infrastructure processes the workloads underneath them. Every enterprise rolling out Claude, every workflow rebuilt around it, every increase in model usage eventually becomes compute, storage, and networking demand flowing straight back to Oracle. Or put another way, today’s infrastructure spend assumes tomorrow’s workloads show up on schedule. 

Every customer Anthropic adds and every dollar of revenue it generates strengthens the case that Oracle’s backlog reflects real demand instead of excessive optimism. The relationship runs both directions, if model builders stall, the infrastructure built underneath them gets questioned next.

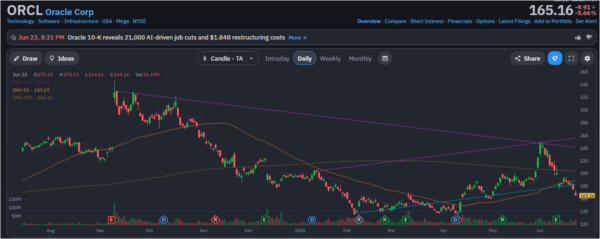
The chart shows the market already wrestling with that tension. Shares ran toward $250 before falling back to roughly $165, now sitting below the 20-day moving average of $203, the 50-day near $190, and the 200-day around $204. The cloud numbers are among the strongest Oracle has ever posted. What’s being priced instead is whether that infrastructure finds enough demand to fill it, and Anthropic’s IPO delivers one of the clearest signals the market will get this year.

Anthropic-StockEarnings

AMD Sells The Hardware That Makes The Bet Real

Oracle sells capacity. Advanced Micro Devices Inc (NASD: AMD) sells the silicon that capacity runs on, and every AI company eventually collides with the same wall regardless of how good its models are: compute.

AMD posted first-quarter revenue of $10.3 billion, up 38% year-over-year. Data Center revenue hit $5.8 billion, growing 57%. Segment operating income climbed 72% to $1.6 billion, and free cash flow reached a record $2.6 billion… numbers describing an industry consuming compute at a pace that barely existed eighteen months ago. 

Management provided another figure that helps explain the scale. 

Meta plans to deploy up to six gigawatts of AMD Instinct GPU capacity across future builds. Utilities use gigawatts to talk about powering cities and industrial corridors. AI infrastructure now speaks the same language, and that alone tells you how far past “tech trend” this buildout has already moved.

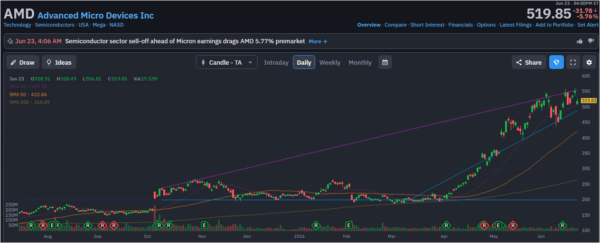
Anthropic operates inside that exact supply chain: Oracle supplies the infrastructure, AMD supplies the hardware, Anthropic consumes both, and every increase in model usage creates demand for accelerators, networking gear, and the cooling and power systems wrapped around them. AMD’s stock reflects institutional conviction that this chain holds together: shares trade near $520, above the 20-day moving average around $510, the 50-day near $423, and the 200-day around $265. That spread between current price and longer-term trend is a market betting heavily that AI demand keeps expanding. Anthropic’s IPO either validates that bet or forces a serious repricing of it.

Anthropic-StockEarnings

This IPO Tests The Entire Ecosystem, Not One Company

Most IPOs like Saudi Aramco, VISA, Amazon etc, reveal something about each company going public. This one reveals something about everyone standing behind it. Oracle’s backlog assumes AI demand keeps compounding. AMD’s valuation assumes model builders keep spending aggressively. Data-center operators keep expanding capacity, utilities keep building new power infrastructure, and capital keeps flowing into every corner of this ecosystem because investors believe large language models eventually generate enough economic value to justify what’s being spent around them.

Anthropic may become the first major public report card on that belief. A strong reception confirms model builders are converting growth into durable businesses and keeps capital flowing into cloud infrastructure and chip production exactly as planned. A weaker one shifts the conversation toward margins, returns on invested capital, and a credible profitability timeline… demands that adoption metrics alone won’t satisfy anymore. In all of these, infrastructure providers keep their existing contracts regardless of which outcome plays out. What changes is how much confidence the market keeps extending to the assumption that demand grows forever.

AI creating real value is not the debate here. What we need to see now is revenue showing up, profitability following it, and returns on capital justifying the money that built this entire stack.

Join over 1.2M+ investors/traders who receive daily and weekly notable earnings alerts with predicted move