ajax loader

Loading...


Ride-the-Wave Strategy – Best for Stock Traders

Ride-the-Wave targets multi-day price momentum following a company’s earnings announcement (EA). With this strategy:

  1. Buy a stock one day post-EA if a stock reacts positively post-earnings:
    1. Near the close of trading the EA-day for a pre-market-EA
    2. Near the close of the following day for a post-market-EA
  2. Sell-to-close after 7-10 days, or possibly earlier if a desired price target is reached

Similarly,

  1. short a stock one day post-EA if a stock reacts negatively post-earnings:
    1. near the close of trading the EA-day for a premarket-EA
    2. near the close of the following day for a post-market-EA
  2. then buy-to-close after 7-10 days, or possibly earlier if a desired price target is reached

Important: Ride-the-Wave is predicated on significant price momentum triggered by an EA. The 7-10 day scenario is the maximum trade hold-time. If you see post EA-momentum is halted or reversed by a significant opposite move, re-evaluate your presence in the trade.

This popular StockEarnings screen below will give you a list of stocks that historically exhibit significant price momentum following an EA for the next seven days:

  1. Stocks exhibiting positive post-EA price moves are buy-candidates
  2. Stocks exhibiting negative post-EA price moves are sell/short-candidates

The screen includes those stocks whose Earnings just came out in last two days.

Screen criteria:

  1. Earnings Date Start Date : Current Date + -1 Day
  2. Earnings Date End Date : Current Date + -2 Days
  3. Predicted Move (Next Day) Max : 7%
  4. Predicted Move (On 7th Day) Min : 7%

Strategy Guideline:

  1. Buy the stock if stock has reacted positively. Short the stock if stock has reacted negatively (see above).
  2. Close the position in 7-10 days, or possibly earlier based on price move.

Volatility Crush Strategy - Best for Options Traders

The Volatility Crush strategy is used with stocks that typically experience relatively low-to-moderate price moves (≤4%) following their Earnings Announcements (EA). The basic trade idea is to sell put or call options right before the EA, collecting a credit when options premium is very high due to elevated implied volatility (IV). You then close the position right after the EA by buying the option back much cheaper due to the significant drop in IV that occurs after the mystery of the EA disappears. In assessing this trade, you need to do your homework to ensure you collect sufficient premium to make the trade worthwhile.

This trade is practical due to the low-to-moderate price-move after the EA, which generally won’t significantly affect the options price, unlike an “action” stock, which experience great price moves post-EA. With these symbols, if you’re on the right side of the price move, that’s a great thing. But if you’re on the wrong side of the move, not so great. Consequently, by minimizing the effect of the post-EA price move, you have a much better chance to profit from the reduction in IV without it being ruined by a violent price move.

For this trade, open the position either (1) the night before the EA when the company announces earnings or (2) during the EA day when it announces post-market, generally capturing IV at or close to its peak.

For this trade, open the position either (1) the night before the EA when the company announces earnings or (2) during the EA day when it announces post-market, generally capturing IV at or close to its peak.

This popular stockearnings screen will give you a list of stocks which do not react more than 4% fpost-EA. It includes only those stocks whose earnings are releasing next day.

Screen criteria:

  1. Earnings Date Start Date : Current Date + 1
  2. Earnings Date End Date : Current Date + 1
  3. Predicted Move (Next Day) Max : 4%
  4. Options Type: Weekly

Strategy Guideline:

  1. Options Strategy: Sell Call and Put
  2. Options Strike Price: Current Stock Price – (% Predicated Move x 2)
  3. Expiration Date: It should generally be the closest expiry immediately after the EA.
  4. Buy Insurance: Buying back Call and Put at Strike price which 10% lower than Sell Strike Price is optional but recommended.

Watch Video for More Detail

Volatility Rush Strategy - Best for Options Traders

The Volatility Rush takes advantage of increasing options premiums into earnings announcements (EA) caused by an anticipated rise in Implied Volatility (IV). With this strategy, Buy a Call and Put at-the-money (a long straddle) 2-3 weeks before the EA when IV is lower. Sell the position either (1) the night before the EA when the company announces earnings pre-market, or (2) during the EA day when it announces post-market, generally capturing IV at or close to its peak.

This popular screen will give you a list of stocks whose Options premiums tend to rise into Earnings. It includes only those stocks whose Earnings are at least two weeks away from today.

Screen criteria:

  1. Earnings Date Start Date : Current Date + 15 Days
  2. Earnings Date End Date : Current Date + 30 Days
  3. Predicted Move (Next Day) Min : 5%
  4. Options Type: Weekly or Monthly if that lines up with the two to three-week lead-time for entering the trade

Strategy Guideline:

  1. Buy a Straddle at or close to the money two to three weeks pre-EA.
  2. Sell the position either the night before the EA when the company announces earnings pre-market, or during the EA day when it announces post-market.
  3. Expiration date should generally be the closest expiry immediately after the EA.
  4. Straddle price should not be more 60% of predicted move.

Predicted Move (Volatility)

Similar to Implied Volatility in Options. Expected volatility % based on our Proprietary Volatility Predication Model. We are expecting that stock price will likely to reach % in either direction by the end of next trading session after Earnings are released and not necessarily the closing volatility %.

Why is it important?

    This indicator helps

  1. Knowing expected volatility in stocks after Earnings helps to decide trading stocks before Earnings Announcement.
  2. Taking Advantage of volatility collapse following Earnings Results by using Advance Options strategies such as Spread and Straddles.

Since Last Earnings

Change in share price since last Earnings release.

Why is it Important?

When share has gained more than 10% since it's last Earning release, it tends to over react to minor bad news and give up some gains if not all. So, it contains more downside volatility than upside When share has dropped more than 10% since it's last Earning release, it tends to over react to minor good news and recover some drops if not all. So, it contains more upside volatility than downside.

EPS Surprise (%)

Occurs when a company's reported quarterly or annual profits are above or below analysts' expectations. Here is the formula to derive % EPS Surprice:

Actual EPS - Estimated EPS
------------------------------------- x 100
Estimated EPS

Why is it Important?

Earnings surprises can have a huge impact on a company's stock price. Several studies suggest that positive earnings surprises not only lead to an immediate hike in a stock's price, but also to a gradual increase over time. Hence, it's not surprising that some companies are known for routinely beating earning projections. A negative earnings surprise will usually result in a decline in share price.

Next Day Price Change (%)

Next Regular trading session Closing price following Earnings result.

For After Market Close Earnings, It is a next trading day closing price. For Before Market Open Earnings, It is the same trading day closing price.

Why is it Important?

Next Day price change is a reaction of Earnings result.

Here’s Why FOX Stock May Be ‘Undervalued’—But It’s Not What You Think

Posted on Jun 24, 2026 by Joshua Enomoto

Here’s Why FOX Stock May Be ‘Undervalued’—But It’s Not What You Think

It’s almost like clockwork. Thanks to Fox Corp’s (NASDAQ: FOX) buyout of Roku (NASDAQ: ROKU), FOX stock tanked sharply. Over the past five sessions, the security incurred a loss of more than 14%. In the trailing month, shares of the mass media company have given up roughly 23%. Since the start of the year, stakeholders are looking at a near 31% hemorrhaging.

That’s not the predictable element that I’m drawing attention to. Rather, it’s the inevitable articles distributed by various financial publication firms that declare FOX stock to be undervalued, largely due to the thesis that the market has become too pessimistic. Since the media giant is relatively financially robust and will enjoy a larger streaming footprint, the assumption is that the positives haven’t been fully and fairly reflected.

It raises the obvious question: how the heck can anyone make such an audacious statement?

I get it. We all talk about undervalued opportunities but at face value, this phrase really is an impossibility. Analysts typically state that because the target security is trading at a lower multiple relative to some time period in the past, the underlying earnings should rerate to this higher valuation.

Again, such conclusions raise the obvious question: how is it possible that anyone — let alone a random independent contributor who has no access to advanced, proprietary datasets — can even begin to shed light on this inquiry?

There’s no scientific law that states low multiples must rerate higher. Worse, I have yet to see a demonstrable inference that low multiples statistically rerate higher than multiples that are deemed fair or high. So when finpub writers talk about undervaluation, don’t just take their word for it — you should assess the evidence they provide.

Unfortunately, there is no evidence to definitively suggest that FOX stock is undervalued. Sure, someone can retort that the 31% year-to-date selloff is too harsh but again, what’s the evidence that it’s too harsh? Maybe the loss is generous and should in fact be much, much worse.

It’s an impossible question to answer but that doesn’t mean we’re left with no insights.

Being Honest About What We Can Decipher About FOX Stock


Despite trashing on cookie-cutter analyses of FOX stock, I do believe that the media giant is “undervalued” — but I use the term with nuance. As stated previously, it’s impossible to know if FOX is undervalued in the abstract or not. That’s because if I say it’s undervalued, I’m essentially saying that the market hasn’t fully priced in the good news.

I simply lack the hubris to make such claims. Let’s look at it from a topical view and consider what’s more plausible? That the aggregate of hedge funds, institutional investors, options traders and retail buyers overlooked critical positives when evaluating FOX stock or some random guy with a Seeking Alpha subscription cracked the secret sauce that has confounded the minds of the greatest scientific experts in human history?

Unless compelling reason exists to suggest otherwise, the current share price of FOX stock represents the aggregation of all meaningful, publicly available data. That’s one hard fact we can depend on.

The other hard fact, though, is that we can observe the statistical variance in performance relative to the target security’s behavioral state. In sports terminology, a soccer ball reacts differently to natural grass than it does on artificial turf.

Stated differently, a security coming off a bullish cycle will likely respond differently over a certain period of time compared to the same security coming off a bearish cycle. This is not a controversial statement. If I ran uphill, I would be more tired than if I ran downhill, all other things being equal.

By measuring the observed performance differences relative to behavioral state, we can estimate where FOX stock may end up in the near future. We can also better determine if it’s worth the risk by comparing the performance variance between trading a targeted signal versus a random long position.

In both counts, I observe FOX stock to be favorable — and that’s why I consider it “undervalued.”

Running a Markov Simulation

Basically, the above framework borrows heavily from a simplified Markov principle: the probability of the future state hinges on the current state. In the case of FOX stock, the security is coming off a bearish cycle — and if we presume a continuation of the overall sentiment regime, the immediate future state is likely to be more positive than what would be expected from a random long position.

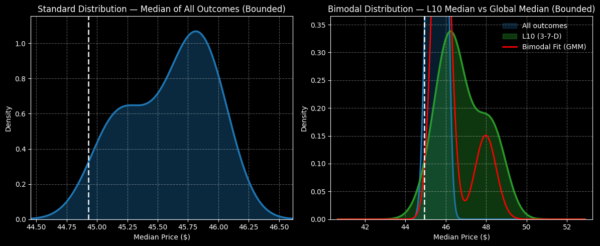
Specifically, if we were to hold FOX stock at random for a 10-week period, we would expect the outcome to range between roughly $44.50 and $46.50 (assuming a starting price of $44.93, Monday’s close). However, with FOX stock coming off a bearish cycle — printing only three up weeks over the past 10 weeks, thereby generating a negative slope across the period — this particular signal has been observed to generate a forward 10-week distribution between $43 and $51.

fox-StockEarnings

Of course, we don’t have a guarantee that FOX stock will follow prior observed trends; the forecast above is an inference and not a logical deduction. Nevertheless, I believe there’s enough positive variance relative to the random baseline to justify a modest bullish position.

If so, I like the 45/50 bull call spread expiring Aug. 21. Statistically speaking, the $50 strike price falls within the realistic distribution of the aforementioned 3-7-D signal. Additionally, the spread’s breakeven price of $47.55 stands roughly in between the expected distribution’s endpoints.

I must reiterate from a risk management perspective that inferences are always subject to the black swan risk; that is, just because you see a thousand white swans doesn’t mean all swans are white. All it takes is one black swan to enter the picture for the inference to instantly blow up.

Still, I will defend the Markov simulation above as being leagues more insightful than hand-waved assertions of misaligned value. Anyone can make a claim about value based on some arbitrary benchmark. With Markov, we’re at least observing empirical data that can be falsified.

Joshua Enomoto is a seasoned financial writer with a strong track record of in-depth stock analysis, offering clear, insightful commentary for retail investors across all levels of expertise. Renowned for his ability to blend analytical rigor with engaging wit, Joshua's work has been featured on leading investment platforms, including TipRanks, InvestorPlace, Barchart, Benzinga, and Fintel. He was also handpicked to spearhead high-impact initiatives such as InvestorPlace's "Trade of the Day" and Benzinga’s ETF coverage. As a frequent guest expert for CGTN America, Joshua discusses a wide range of economic, societal, and consumer market trends. A graduate of U.C. San Diego, Joshua brings a thoughtful and fresh perspective to complex financial narratives, helping enterprise clients connect with their audiences. He also composes music in his spare time.

Join over 1.2M+ investors/traders who receive daily and weekly notable earnings alerts with predicted move