ajax loader

Loading...


Ride-the-Wave Strategy – Best for Stock Traders

Ride-the-Wave targets multi-day price momentum following a company’s earnings announcement (EA). With this strategy:

  1. Buy a stock one day post-EA if a stock reacts positively post-earnings:
    1. Near the close of trading the EA-day for a pre-market-EA
    2. Near the close of the following day for a post-market-EA
  2. Sell-to-close after 7-10 days, or possibly earlier if a desired price target is reached

Similarly,

  1. short a stock one day post-EA if a stock reacts negatively post-earnings:
    1. near the close of trading the EA-day for a premarket-EA
    2. near the close of the following day for a post-market-EA
  2. then buy-to-close after 7-10 days, or possibly earlier if a desired price target is reached

Important: Ride-the-Wave is predicated on significant price momentum triggered by an EA. The 7-10 day scenario is the maximum trade hold-time. If you see post EA-momentum is halted or reversed by a significant opposite move, re-evaluate your presence in the trade.

This popular StockEarnings screen below will give you a list of stocks that historically exhibit significant price momentum following an EA for the next seven days:

  1. Stocks exhibiting positive post-EA price moves are buy-candidates
  2. Stocks exhibiting negative post-EA price moves are sell/short-candidates

The screen includes those stocks whose Earnings just came out in last two days.

Screen criteria:

  1. Earnings Date Start Date : Current Date + -1 Day
  2. Earnings Date End Date : Current Date + -2 Days
  3. Predicted Move (Next Day) Max : 7%
  4. Predicted Move (On 7th Day) Min : 7%

Strategy Guideline:

  1. Buy the stock if stock has reacted positively. Short the stock if stock has reacted negatively (see above).
  2. Close the position in 7-10 days, or possibly earlier based on price move.

Volatility Crush Strategy - Best for Options Traders

The Volatility Crush strategy is used with stocks that typically experience relatively low-to-moderate price moves (≤4%) following their Earnings Announcements (EA). The basic trade idea is to sell put or call options right before the EA, collecting a credit when options premium is very high due to elevated implied volatility (IV). You then close the position right after the EA by buying the option back much cheaper due to the significant drop in IV that occurs after the mystery of the EA disappears. In assessing this trade, you need to do your homework to ensure you collect sufficient premium to make the trade worthwhile.

This trade is practical due to the low-to-moderate price-move after the EA, which generally won’t significantly affect the options price, unlike an “action” stock, which experience great price moves post-EA. With these symbols, if you’re on the right side of the price move, that’s a great thing. But if you’re on the wrong side of the move, not so great. Consequently, by minimizing the effect of the post-EA price move, you have a much better chance to profit from the reduction in IV without it being ruined by a violent price move.

For this trade, open the position either (1) the night before the EA when the company announces earnings or (2) during the EA day when it announces post-market, generally capturing IV at or close to its peak.

For this trade, open the position either (1) the night before the EA when the company announces earnings or (2) during the EA day when it announces post-market, generally capturing IV at or close to its peak.

This popular stockearnings screen will give you a list of stocks which do not react more than 4% fpost-EA. It includes only those stocks whose earnings are releasing next day.

Screen criteria:

  1. Earnings Date Start Date : Current Date + 1
  2. Earnings Date End Date : Current Date + 1
  3. Predicted Move (Next Day) Max : 4%
  4. Options Type: Weekly

Strategy Guideline:

  1. Options Strategy: Sell Call and Put
  2. Options Strike Price: Current Stock Price – (% Predicated Move x 2)
  3. Expiration Date: It should generally be the closest expiry immediately after the EA.
  4. Buy Insurance: Buying back Call and Put at Strike price which 10% lower than Sell Strike Price is optional but recommended.

Watch Video for More Detail

Volatility Rush Strategy - Best for Options Traders

The Volatility Rush takes advantage of increasing options premiums into earnings announcements (EA) caused by an anticipated rise in Implied Volatility (IV). With this strategy, Buy a Call and Put at-the-money (a long straddle) 2-3 weeks before the EA when IV is lower. Sell the position either (1) the night before the EA when the company announces earnings pre-market, or (2) during the EA day when it announces post-market, generally capturing IV at or close to its peak.

This popular screen will give you a list of stocks whose Options premiums tend to rise into Earnings. It includes only those stocks whose Earnings are at least two weeks away from today.

Screen criteria:

  1. Earnings Date Start Date : Current Date + 15 Days
  2. Earnings Date End Date : Current Date + 30 Days
  3. Predicted Move (Next Day) Min : 5%
  4. Options Type: Weekly or Monthly if that lines up with the two to three-week lead-time for entering the trade

Strategy Guideline:

  1. Buy a Straddle at or close to the money two to three weeks pre-EA.
  2. Sell the position either the night before the EA when the company announces earnings pre-market, or during the EA day when it announces post-market.
  3. Expiration date should generally be the closest expiry immediately after the EA.
  4. Straddle price should not be more 60% of predicted move.

Predicted Move (Volatility)

Similar to Implied Volatility in Options. Expected volatility % based on our Proprietary Volatility Predication Model. We are expecting that stock price will likely to reach % in either direction by the end of next trading session after Earnings are released and not necessarily the closing volatility %.

Why is it important?

    This indicator helps

  1. Knowing expected volatility in stocks after Earnings helps to decide trading stocks before Earnings Announcement.
  2. Taking Advantage of volatility collapse following Earnings Results by using Advance Options strategies such as Spread and Straddles.

Since Last Earnings

Change in share price since last Earnings release.

Why is it Important?

When share has gained more than 10% since it's last Earning release, it tends to over react to minor bad news and give up some gains if not all. So, it contains more downside volatility than upside When share has dropped more than 10% since it's last Earning release, it tends to over react to minor good news and recover some drops if not all. So, it contains more upside volatility than downside.

EPS Surprise (%)

Occurs when a company's reported quarterly or annual profits are above or below analysts' expectations. Here is the formula to derive % EPS Surprice:

Actual EPS - Estimated EPS
------------------------------------- x 100
Estimated EPS

Why is it Important?

Earnings surprises can have a huge impact on a company's stock price. Several studies suggest that positive earnings surprises not only lead to an immediate hike in a stock's price, but also to a gradual increase over time. Hence, it's not surprising that some companies are known for routinely beating earning projections. A negative earnings surprise will usually result in a decline in share price.

Next Day Price Change (%)

Next Regular trading session Closing price following Earnings result.

For After Market Close Earnings, It is a next trading day closing price. For Before Market Open Earnings, It is the same trading day closing price.

Why is it Important?

Next Day price change is a reaction of Earnings result.

The Bond Market Isn’t Buying The Fed’s Story

Posted on Jun 23, 2026 by Grayson Cavern

The Bond Market Isn’t Buying The Fed’s Story

Jerome Powell keeps saying inflation is headed to 2%. Kevin Warsh backs him up, talking up the Fed’s commitment to price stability like it’s a settled question. The bond market isn’t buying a word of it because unlike the talking heads on a panel, bond investors put actual money behind their disagreement. 

Why would they? 

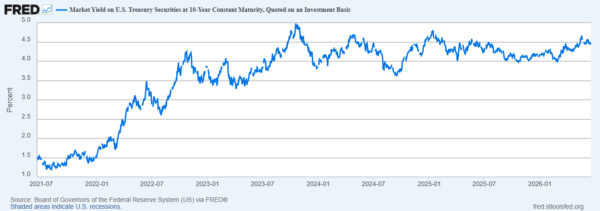
The yield on the 10-Year Treasury recently pushed above 4.5%. The 30-Year cleared 5%. Those yields are the foundation everything else in finance gets priced off of – your mortgage, your company’s borrowing costs, the multiple Wall Street is willing to slap on every growth stock you own.

But you see, a market that genuinely believed inflation was heading to 2% with rate cuts coming wouldn’t be demanding some of the highest long-term yields we’ve seen in years. Which tells you that the bond market is calling the Fed’s bluff in real time, with trillions of dollars behind the bet.

bond-StockEarnings

Bond Investors Are Underwriting The Next Three Decades.


The Fed’s job is narrow –inflation, employment, financial stability, measured in quarters. A pension fund buying a 30-year Treasury isn’t playing that game. They’re underwriting purchasing power three decades out, government borrowing across multiple administrations and multiple crises nobody’s predicted yet, and whether the dollars they get back will still mean anything when they get them.

That’s a completely different bet than guessing next month’s CPI print.

Chicago Fed President Austan Goolsbee already acknowledged inflation has moved the wrong direction, and the last stretch back to target is proving harder than the easy progress it made. The bond market priced that risk in before Goolsbee said it out loud. Inflation has cooled a lot from the 2022 peak. Yet yields haven’t followed it down because investors are trying to determine what inflation looks like over the next 3 decades, not the next quarter.

Washington’s Borrowing Habit

Inflation gets the headlines because it’s easy to talk about on TV. Debt is the bigger problem, and it’s getting almost no airtime relative to its size. We’re carrying north of $36 trillion in federal debt now, with interest expense becoming one of the fastest-growing costs in the entire federal budget… faster-growing than most line items anyone in Washington actually wants to discuss in an election year.

Run the logic forward. Deficits don’t close themselves. The Treasury has to issue more debt to cover them. More issuance means more supply hitting the market. More supply means buyers get to demand a better price for showing up – and that price is yield. The Treasury market is the deepest, most liquid market on earth, and it still answers to the same supply-and-demand math as everything else. You can’t flood a market with trillions in new paper every year and expect buyers to keep accepting the same terms forever.

That’s what’s actually being priced into the long end right now. Not just where inflation lands next year, whether the U.S. can keep borrowing at this scale without eventually having to pay up for the privilege.

If You’re Trading Equities And Ignoring This, You’re Trading Half-Blind

Most traders live inside earnings prints and chart patterns and treat the bond market like it’s somebody else’s problem. That’s a mistake that gets expensive fast, because Treasury yields set the terms everyone else is playing under whether they realize it or not. Higher yields mean a higher discount rate on every future cash flow, which hits growth names hardest, since their value sits furthest out on the timeline. Private equity financing gets pricier. Commercial real estate eats another round of pressure. Corporate borrowing costs climb across every sector simultaneously.

None of that stays contained to a bond desk. It bleeds into equities with a lag long enough that most traders don’t connect the dots until their own positions are already bleeding too. The real question isn’t whether the Fed cuts once or three times this year. It’s whether rates are settling into a structurally higher range than almost anybody priced in twelve months ago – and that single shift reaches into tech valuations, housing, and credit markets in ways that dwarf whatever happens at the next FOMC meeting.

We’ve Run This Playbook Before

History doesn’t repeat exactly, but it rhymes enough to matter. Through the late ‘60s and most of the ‘70s, policymakers kept telling markets inflation pressure would fade on its own. Bond investors didn’t buy it then either, and they kept demanding higher yields to compensate for risk they didn’t believe was actually handled. Inflation eventually proved them right.

Although today’s setup isn’t identical – stronger economy, more credible Fed, deeper markets – the mechanism hasn’t changed an inch. Bond investors still care about whether the money they get back is still worth something. When that confidence cracks, yields go up and it doesn’t matter how convincingly the people in charge insist otherwise.

Pay Attention Now

Stocks like NVIDIA (NASDAQ: NVDA) dominate the news cycle because they move fast and make for good headlines. On the flip side, bonds move slowly, then all at once, and by the time everyone notices, the damage is already done. A rising 10-Year works its way into your mortgage, your company’s capital plans, your retirement account, and the multiple Wall Street pays for your stocks, whether you’re watching for it or not.

Maybe inflation keeps cooling. Maybe Washington gets its deficit under control. Maybe the market just absorbs the issuance without blinking. None of that is priced in right now. And that gap, between the comfortable story the Fed keeps telling and the price bond investors are actually demanding, is one of the more important disagreements in markets today. When trillions of dollars start pricing a different future than the one policymakers keep selling, everyone should pay attention.

Join over 1.2M+ investors/traders who receive daily and weekly notable earnings alerts with predicted move