ajax loader

Loading...


Ride-the-Wave Strategy – Best for Stock Traders

Ride-the-Wave targets multi-day price momentum following a company’s earnings announcement (EA). With this strategy:

  1. Buy a stock one day post-EA if a stock reacts positively post-earnings:
    1. Near the close of trading the EA-day for a pre-market-EA
    2. Near the close of the following day for a post-market-EA
  2. Sell-to-close after 7-10 days, or possibly earlier if a desired price target is reached

Similarly,

  1. short a stock one day post-EA if a stock reacts negatively post-earnings:
    1. near the close of trading the EA-day for a premarket-EA
    2. near the close of the following day for a post-market-EA
  2. then buy-to-close after 7-10 days, or possibly earlier if a desired price target is reached

Important: Ride-the-Wave is predicated on significant price momentum triggered by an EA. The 7-10 day scenario is the maximum trade hold-time. If you see post EA-momentum is halted or reversed by a significant opposite move, re-evaluate your presence in the trade.

This popular StockEarnings screen below will give you a list of stocks that historically exhibit significant price momentum following an EA for the next seven days:

  1. Stocks exhibiting positive post-EA price moves are buy-candidates
  2. Stocks exhibiting negative post-EA price moves are sell/short-candidates

The screen includes those stocks whose Earnings just came out in last two days.

Screen criteria:

  1. Earnings Date Start Date : Current Date + -1 Day
  2. Earnings Date End Date : Current Date + -2 Days
  3. Predicted Move (Next Day) Max : 7%
  4. Predicted Move (On 7th Day) Min : 7%

Strategy Guideline:

  1. Buy the stock if stock has reacted positively. Short the stock if stock has reacted negatively (see above).
  2. Close the position in 7-10 days, or possibly earlier based on price move.

Volatility Crush Strategy - Best for Options Traders

The Volatility Crush strategy is used with stocks that typically experience relatively low-to-moderate price moves (≤4%) following their Earnings Announcements (EA). The basic trade idea is to sell put or call options right before the EA, collecting a credit when options premium is very high due to elevated implied volatility (IV). You then close the position right after the EA by buying the option back much cheaper due to the significant drop in IV that occurs after the mystery of the EA disappears. In assessing this trade, you need to do your homework to ensure you collect sufficient premium to make the trade worthwhile.

This trade is practical due to the low-to-moderate price-move after the EA, which generally won’t significantly affect the options price, unlike an “action” stock, which experience great price moves post-EA. With these symbols, if you’re on the right side of the price move, that’s a great thing. But if you’re on the wrong side of the move, not so great. Consequently, by minimizing the effect of the post-EA price move, you have a much better chance to profit from the reduction in IV without it being ruined by a violent price move.

For this trade, open the position either (1) the night before the EA when the company announces earnings or (2) during the EA day when it announces post-market, generally capturing IV at or close to its peak.

For this trade, open the position either (1) the night before the EA when the company announces earnings or (2) during the EA day when it announces post-market, generally capturing IV at or close to its peak.

This popular stockearnings screen will give you a list of stocks which do not react more than 4% fpost-EA. It includes only those stocks whose earnings are releasing next day.

Screen criteria:

  1. Earnings Date Start Date : Current Date + 1
  2. Earnings Date End Date : Current Date + 1
  3. Predicted Move (Next Day) Max : 4%
  4. Options Type: Weekly

Strategy Guideline:

  1. Options Strategy: Sell Call and Put
  2. Options Strike Price: Current Stock Price – (% Predicated Move x 2)
  3. Expiration Date: It should generally be the closest expiry immediately after the EA.
  4. Buy Insurance: Buying back Call and Put at Strike price which 10% lower than Sell Strike Price is optional but recommended.

Watch Video for More Detail

Volatility Rush Strategy - Best for Options Traders

The Volatility Rush takes advantage of increasing options premiums into earnings announcements (EA) caused by an anticipated rise in Implied Volatility (IV). With this strategy, Buy a Call and Put at-the-money (a long straddle) 2-3 weeks before the EA when IV is lower. Sell the position either (1) the night before the EA when the company announces earnings pre-market, or (2) during the EA day when it announces post-market, generally capturing IV at or close to its peak.

This popular screen will give you a list of stocks whose Options premiums tend to rise into Earnings. It includes only those stocks whose Earnings are at least two weeks away from today.

Screen criteria:

  1. Earnings Date Start Date : Current Date + 15 Days
  2. Earnings Date End Date : Current Date + 30 Days
  3. Predicted Move (Next Day) Min : 5%
  4. Options Type: Weekly or Monthly if that lines up with the two to three-week lead-time for entering the trade

Strategy Guideline:

  1. Buy a Straddle at or close to the money two to three weeks pre-EA.
  2. Sell the position either the night before the EA when the company announces earnings pre-market, or during the EA day when it announces post-market.
  3. Expiration date should generally be the closest expiry immediately after the EA.
  4. Straddle price should not be more 60% of predicted move.

Predicted Move (Volatility)

Similar to Implied Volatility in Options. Expected volatility % based on our Proprietary Volatility Predication Model. We are expecting that stock price will likely to reach % in either direction by the end of next trading session after Earnings are released and not necessarily the closing volatility %.

Why is it important?

    This indicator helps

  1. Knowing expected volatility in stocks after Earnings helps to decide trading stocks before Earnings Announcement.
  2. Taking Advantage of volatility collapse following Earnings Results by using Advance Options strategies such as Spread and Straddles.

Since Last Earnings

Change in share price since last Earnings release.

Why is it Important?

When share has gained more than 10% since it's last Earning release, it tends to over react to minor bad news and give up some gains if not all. So, it contains more downside volatility than upside When share has dropped more than 10% since it's last Earning release, it tends to over react to minor good news and recover some drops if not all. So, it contains more upside volatility than downside.

EPS Surprise (%)

Occurs when a company's reported quarterly or annual profits are above or below analysts' expectations. Here is the formula to derive % EPS Surprice:

Actual EPS - Estimated EPS
------------------------------------- x 100
Estimated EPS

Why is it Important?

Earnings surprises can have a huge impact on a company's stock price. Several studies suggest that positive earnings surprises not only lead to an immediate hike in a stock's price, but also to a gradual increase over time. Hence, it's not surprising that some companies are known for routinely beating earning projections. A negative earnings surprise will usually result in a decline in share price.

Next Day Price Change (%)

Next Regular trading session Closing price following Earnings result.

For After Market Close Earnings, It is a next trading day closing price. For Before Market Open Earnings, It is the same trading day closing price.

Why is it Important?

Next Day price change is a reaction of Earnings result.

3 Stocks to Buy Despite Fears of Rising Consumer Debt

Posted on Jun 23, 2026 by Chris Markoch

3 Stocks to Buy Despite Fears of Rising Consumer Debt

There’s a conflicting picture about consumer debt, and it’s more than just whether you look at the glass as being half empty or half full. That is, it’s not a case of perception. Instead, recent data shows that consumer debt reflects the reality of many Americans. 

On the one hand, Société Générale, a leading European bank, recently issued a note to its clients. According to the bank, total U.S. household debt is at record levels. That includes mortgage, credit cards, student loans, and auto loans. However, investors would do well to avoid taking that headline at face value. The implications are different based on the K-shaped nature of the economy.  

For example, household debt service (i.e. the amount that consumers are required to pay every month) as a percentage of disposable personal income is below any point prior to 2020. Plus, Americans’ liquid net worth (i.e., cash on hand) is near its highest level in three decades. 

But that’s an aggregate number. When you look at households with income on the lower leg of the K-shaped economy, the cracks and stress appear.  

This is a story that’s been building for several years but is reaching critical mass as the rate of inflation continues to accelerate. It also provides a template for how investors should position themselves with stocks that are built to manage consumer uncertainty.  

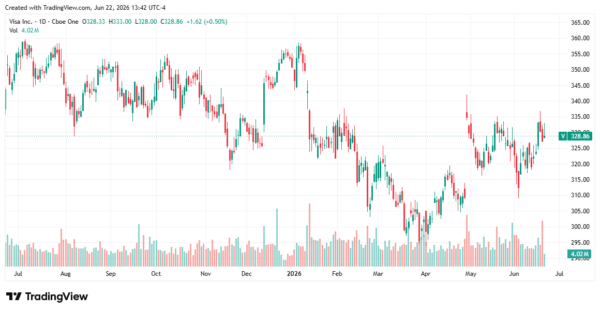
Visa Is Like Buying the Tollbooth on Borrowing 


Visa (NYSE: V) is part of what remains a duopoly among payment servicers in the credit market. It operates similarly to a pipeline company in the oil and gas industry. It’s agnostic to inflation; the only thing that matters is payment flow.  

The year-over-year (YOY) increases in revenue and earnings per share support the idea that consumers are borrowing at higher levels. The company’s Q2 2026 earnings report showed strong YOY beats and increased guidance for the full year. 

Visa also builds shareholder equity. It repurchased a record $7.9 billion in shares in the quarter, paid out $1.3 billion in dividends, and the board approved a new $20 billion repurchase program that increases the company’s total buyback capacity to $33 billion.  

And Visa is not overlooking the digital revolution. In the last quarter, the company highlighted several product launches that set it up for growth in the areas of agentic commerce and stablecoins/blockchain.  

But V stock is trading at a discount. It’s down 2.8% in the last 12 months, with almost that entire loss coming since the start of the year. That said, the valuation looks attractive for a company that’s forecasting approximately 13% earnings growth in the next 12 months.  

consumer debt - StockEarnings

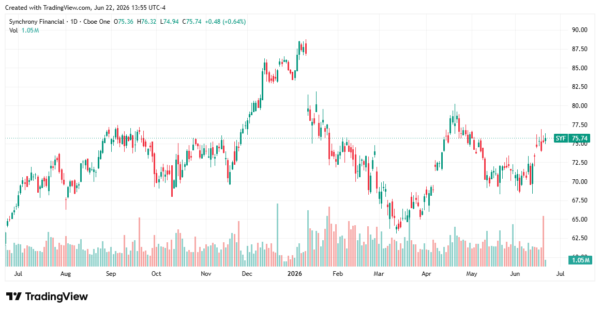
Synchrony Bank is a High-Risk, High-Reward Play 

The name Synchrony Financial (NYSE: SYF) may not be immediately familiar, but its partners certainly are. The company powers the store credit cards for brands like Amazon, PayPal, and Lowe’s, operating across more than 73 million active accounts. That scale makes SYF one of the most direct expressions of consumer credit stress and a compelling contrarian opportunity. 

Here’s how that case lays out. Synchrony carries one of the highest 30-plus-day delinquency rates among major card issuers, serving lower-prime and retail-store card segments at roughly double the rate of JPMorgan and Citigroup. That’s the bad news, and it’s priced in. SYF has pulled back significantly from its highs, with analysts’ price targets being cut broadly across consumer finance names.  

But the market may be over-discounting the risk. The company’s Q1 2026 EPS rose 20% year-over-year to $2.27, net interest margin expanded to 15.5%, loan yields came in at 21.8%, and charge-offs actually declined to 5.42%. Management also maintained its full-year EPS guidance of $9.10 to $9.50 and expects net charge-offs to remain below 5.5% for the year, with loan receivables growing in the mid-single digits by year-end.  

Capital returns tell the same story of confidence. The board approved a new $6.5 billion share repurchase program with no expiration date, replacing the prior program, and also approved a planned 13% increase in the quarterly cash dividend to $0.34 per share beginning in Q3 2026.  

The stock trades at a forward P/E of just over 8x, well below the S&P 500 average, while analysts maintain a consensus Buy rating with 16 buy ratings versus only one sell, and a consensus price target implying roughly 26% upside from current levels. For investors willing to hold through near-term volatility, SYF offers an attractive entry point into a business that is built to profit from a consumer debt environment.  

consumer debt - StockEarnings

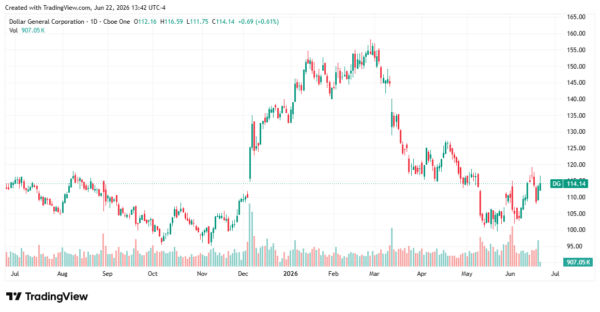
Dollar General Will Benefit from the Spending Squeeze 

Discount retailers were the winners of the first quarter earnings season. And there was, perhaps, no better example of that than the report from Dollar General (NYSE: DG). The company reported a top- and bottom-line beat, along with an increase in same-store sales.  

That trifecta, along with rising consumer debt data, should have sent DG stock soaring. But it didn’t, as investors took to selling out of retail stocks in the SpaceX hype. That trend has reversed, and with the stock down nearly 14% in 2026, this could be an excellent time to get in on DG stock at a discount.  

One reason to believe in Dollar General was what management had to say about the consumer who was coming through the door. It’s not just the lower-income consumer. Even more affluent consumers are hunting for value. Given that inflation is likely to remain above the Federal Reserve’s preferred target for some time, that trend is likely to stay in place. 

consumer debt - StockEarnings

These 3 Stocks Can Help Investors Navigate the Consumer Debt Crossroads 

The Société Générale note is a useful reminder, not a fire alarm. Record consumer debt is a real trend with real consequences — but it plays out unevenly, and that’s where opportunity lives for investors who look past the headline. 

Visa benefits regardless of whether borrowers pay their full balances or carry them, collecting its toll every time a card is swiped. Synchrony is priced as if the consumer credit cycle is worsening, even as its own data show charge-offs stabilizing and earnings growing. And Dollar General is positioned to capture the trade-down behavior that typically accelerates when household budgets are squeezed. 

None of these is a bet that the economy weakens further. Instead, they’re bets that the K-shaped reality of consumer debt — stressed at the lower end, resilient in aggregate — continues to shape spending and credit behavior for the foreseeable future. That’s a durable enough thesis to act on today.

A former marketing copywriter turned freelance financial writer and market analyst. I have a passion for delivering insights to investors. I write regularly about stocks for StockEarnings and MarketBeat. Posts are not advice.

Join over 1.2M+ investors/traders who receive daily and weekly notable earnings alerts with predicted move