ajax loader

Loading...


Ride-the-Wave Strategy – Best for Stock Traders

Ride-the-Wave targets multi-day price momentum following a company’s earnings announcement (EA). With this strategy:

  1. Buy a stock one day post-EA if a stock reacts positively post-earnings:
    1. Near the close of trading the EA-day for a pre-market-EA
    2. Near the close of the following day for a post-market-EA
  2. Sell-to-close after 7-10 days, or possibly earlier if a desired price target is reached

Similarly,

  1. short a stock one day post-EA if a stock reacts negatively post-earnings:
    1. near the close of trading the EA-day for a premarket-EA
    2. near the close of the following day for a post-market-EA
  2. then buy-to-close after 7-10 days, or possibly earlier if a desired price target is reached

Important: Ride-the-Wave is predicated on significant price momentum triggered by an EA. The 7-10 day scenario is the maximum trade hold-time. If you see post EA-momentum is halted or reversed by a significant opposite move, re-evaluate your presence in the trade.

This popular StockEarnings screen below will give you a list of stocks that historically exhibit significant price momentum following an EA for the next seven days:

  1. Stocks exhibiting positive post-EA price moves are buy-candidates
  2. Stocks exhibiting negative post-EA price moves are sell/short-candidates

The screen includes those stocks whose Earnings just came out in last two days.

Screen criteria:

  1. Earnings Date Start Date : Current Date + -1 Day
  2. Earnings Date End Date : Current Date + -2 Days
  3. Predicted Move (Next Day) Max : 7%
  4. Predicted Move (On 7th Day) Min : 7%

Strategy Guideline:

  1. Buy the stock if stock has reacted positively. Short the stock if stock has reacted negatively (see above).
  2. Close the position in 7-10 days, or possibly earlier based on price move.

Volatility Crush Strategy - Best for Options Traders

The Volatility Crush strategy is used with stocks that typically experience relatively low-to-moderate price moves (≤4%) following their Earnings Announcements (EA). The basic trade idea is to sell put or call options right before the EA, collecting a credit when options premium is very high due to elevated implied volatility (IV). You then close the position right after the EA by buying the option back much cheaper due to the significant drop in IV that occurs after the mystery of the EA disappears. In assessing this trade, you need to do your homework to ensure you collect sufficient premium to make the trade worthwhile.

This trade is practical due to the low-to-moderate price-move after the EA, which generally won’t significantly affect the options price, unlike an “action” stock, which experience great price moves post-EA. With these symbols, if you’re on the right side of the price move, that’s a great thing. But if you’re on the wrong side of the move, not so great. Consequently, by minimizing the effect of the post-EA price move, you have a much better chance to profit from the reduction in IV without it being ruined by a violent price move.

For this trade, open the position either (1) the night before the EA when the company announces earnings or (2) during the EA day when it announces post-market, generally capturing IV at or close to its peak.

For this trade, open the position either (1) the night before the EA when the company announces earnings or (2) during the EA day when it announces post-market, generally capturing IV at or close to its peak.

This popular stockearnings screen will give you a list of stocks which do not react more than 4% fpost-EA. It includes only those stocks whose earnings are releasing next day.

Screen criteria:

  1. Earnings Date Start Date : Current Date + 1
  2. Earnings Date End Date : Current Date + 1
  3. Predicted Move (Next Day) Max : 4%
  4. Options Type: Weekly

Strategy Guideline:

  1. Options Strategy: Sell Call and Put
  2. Options Strike Price: Current Stock Price – (% Predicated Move x 2)
  3. Expiration Date: It should generally be the closest expiry immediately after the EA.
  4. Buy Insurance: Buying back Call and Put at Strike price which 10% lower than Sell Strike Price is optional but recommended.

Watch Video for More Detail

Volatility Rush Strategy - Best for Options Traders

The Volatility Rush takes advantage of increasing options premiums into earnings announcements (EA) caused by an anticipated rise in Implied Volatility (IV). With this strategy, Buy a Call and Put at-the-money (a long straddle) 2-3 weeks before the EA when IV is lower. Sell the position either (1) the night before the EA when the company announces earnings pre-market, or (2) during the EA day when it announces post-market, generally capturing IV at or close to its peak.

This popular screen will give you a list of stocks whose Options premiums tend to rise into Earnings. It includes only those stocks whose Earnings are at least two weeks away from today.

Screen criteria:

  1. Earnings Date Start Date : Current Date + 15 Days
  2. Earnings Date End Date : Current Date + 30 Days
  3. Predicted Move (Next Day) Min : 5%
  4. Options Type: Weekly or Monthly if that lines up with the two to three-week lead-time for entering the trade

Strategy Guideline:

  1. Buy a Straddle at or close to the money two to three weeks pre-EA.
  2. Sell the position either the night before the EA when the company announces earnings pre-market, or during the EA day when it announces post-market.
  3. Expiration date should generally be the closest expiry immediately after the EA.
  4. Straddle price should not be more 60% of predicted move.

Predicted Move (Volatility)

Similar to Implied Volatility in Options. Expected volatility % based on our Proprietary Volatility Predication Model. We are expecting that stock price will likely to reach % in either direction by the end of next trading session after Earnings are released and not necessarily the closing volatility %.

Why is it important?

    This indicator helps

  1. Knowing expected volatility in stocks after Earnings helps to decide trading stocks before Earnings Announcement.
  2. Taking Advantage of volatility collapse following Earnings Results by using Advance Options strategies such as Spread and Straddles.

Since Last Earnings

Change in share price since last Earnings release.

Why is it Important?

When share has gained more than 10% since it's last Earning release, it tends to over react to minor bad news and give up some gains if not all. So, it contains more downside volatility than upside When share has dropped more than 10% since it's last Earning release, it tends to over react to minor good news and recover some drops if not all. So, it contains more upside volatility than downside.

EPS Surprise (%)

Occurs when a company's reported quarterly or annual profits are above or below analysts' expectations. Here is the formula to derive % EPS Surprice:

Actual EPS - Estimated EPS
------------------------------------- x 100
Estimated EPS

Why is it Important?

Earnings surprises can have a huge impact on a company's stock price. Several studies suggest that positive earnings surprises not only lead to an immediate hike in a stock's price, but also to a gradual increase over time. Hence, it's not surprising that some companies are known for routinely beating earning projections. A negative earnings surprise will usually result in a decline in share price.

Next Day Price Change (%)

Next Regular trading session Closing price following Earnings result.

For After Market Close Earnings, It is a next trading day closing price. For Before Market Open Earnings, It is the same trading day closing price.

Why is it Important?

Next Day price change is a reaction of Earnings result.

Avoid the Crowd with a Long Position in Pharma Giant Merck (MRK) Stock

Posted on Jun 23, 2026 by Joshua Enomoto

Avoid the Crowd with a Long Position in Pharma Giant Merck (MRK) Stock

It’s one of the most surprising developments in politics: President Donald Trump, known for his outspoken views and no-nonsense approach to even the most delicate and controversial topics, basically relented. With the Iran conflict apparently coming to a close, this unexpected dynamic has significant implications for pharmaceutical giant Merck (NYSE: MRK).

At first glance, MRK stock doesn’t appear to have much direct relevance to the Iran war, which threatened to drag the world into a catastrophic depression. However, now that the Trump administration has signaled that it takes the threat of Iran bringing the global economy to its knees seriously, the worst-case scenario is apparently behind us.

Of course, we still must consider multiple variables in this situation. For one thing, both the U.S. and Iran can ultimately disagree on the performance of the underlying memorandum of understanding. If so, Trump may decide to pull the trigger again on military action. Further, Israel’s displeasure at the sudden peace agreement imposes a serious wrinkle on the discussion.

Still, if we were to take the deal at face value, the U.S. has decided that a prolonged conflict with Iran wasn’t worth the economic and societal damage that would likely erupt. As such, previously popular equities have seen a dramatic resurgence of demand — and that may pull public money due to the ‘FOMO’ effect.

It’s no secret that many astute investors would rather consider opportunities that haven’t attracted mass attention. After all, there’s always a risk that too much money going into one place may spark a bearish reaction as the weak hands blink first. That’s where MRK stock comes into the picture. At this point, with the spotlight focused squarely on artificial intelligence and other tech-related names, a company like Merck flies under the radar.

On a year-to-date basis, MRK stock is relatively pedestrian, gaining a little over 8%. Over the trailing month, the security has lost 7% of value, potentially making it an intriguing prospect under the presupposition of mean reversion theory.

Volatility Skew Offers Key Insights for MRK Stock


With a pharmaceutical company like Merck, much of its trading and investment prospect obviously lies with progress on its flagship pipelines. That’s not something that’s easy to predict. But in the interim of these disclosure cycles, we can potentially exploit its technical rumblings.

For options traders, one of the most useful tools to consider is the volatility skew. By definition, the skew showcases implied volatility (IV) across the strike price spectrum of a given options chain. Since IV represents the range of motion for a security at a select strike, a heightened volatility reading incentives traders to hedge the potential move.

In other words, the skew represents an insurance market. At any given moment, a popular security is liable to move either up or down. Since traders aren’t prescient, they must pay a protection premium so that they’re not caught out. Generally speaking, for mature equities, this premium is concentrated on put options, since there’s a greater risk of such stocks losing value quickly rather than vice versa.

Interestingly, though, for Merck stock, the skew features a pronounced “smile” that is unlike what you might usually find with blue chips. Basically, put IV for the near-term July 10 expiration date swings sharply higher at the right-side tail (lower strike price range). This dynamic possibly indicates that smart money traders are assigning at least some probability to a severe negative event.

Still, that’s not the only prominent characteristic of the skew. On the left-hand tail, call IV rises robustly for further out-the-money (OTM) strikes. When looking at this angle, traders are evidently paying a heightened premium for upside convexity.

Broadly speaking, the smart money wants to be protected from catastrophe but it also desires exposure to potential upside swings. More specifically, there’s not much insurance demand for “realistic” strikes or strikes near the plausible trading range of MRK stock. Instead, the protection is centered on the two tails.

To be fair, the skew isn’t necessarily pounding the table on either side of the trade. However, it’s only natural for traders to hedge against downside amid the current geopolitical environment. Fortunately, as cooler heads prevail over the Iran conflict, there’s now demand for enhanced upside. It’s this new framework which I believe speculators may be able to exploit.

Using an Inductive Model to Trade Merck Stock

While the volatility skew doesn’t offer a hard probability regarding future outcomes, we can use an inductive model — a Markov simulation to be precise — to forecast potential results. What aroused my attention to MRK stock is that, unlike other securities, it has suffered a significant slowdown in momentum. Again, under mean reversion theory, we may expect MRK to bounce back.

Merck-StockEarnings

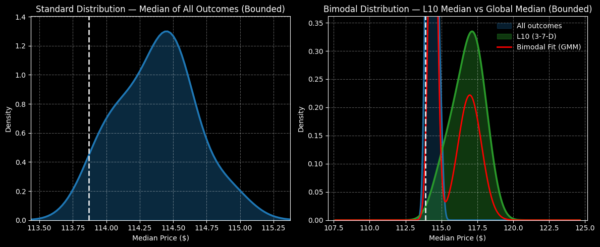
Notably, in the last 10 weeks, MRK stock has only printed three up weeks, leading to a downward slope. Under this 3-7-D sequence, over the next 10 weeks, the security has a median tendency of ranging between $112.50 and $120 (assuming a starting price of $113.87, Friday’s close). This distribution represents a sizable variance over a random 10-week long position, which would typically range between $113 and $115.50.

Even more enticing, over the next three weeks following a 3-7-D signal flashing, Merck stock has demonstrated a tendency of rising to approximately the $118 level (assuming the same aforementioned starting price). If this pattern were to materialize again, the 114/118 bull call spread expiring July 10 could be in play.

Basically, this trade requires MRK stock to rise through the $118 strike at expiration. If so, the maximum payout would be over 56%. The net debit per spread would be $256. Although this is a bit on the pricey side, you’d be trading a quality blue chip that is statistically stable, given its 60-month beta of only 0.21.

Joshua Enomoto is a seasoned financial writer with a strong track record of in-depth stock analysis, offering clear, insightful commentary for retail investors across all levels of expertise. Renowned for his ability to blend analytical rigor with engaging wit, Joshua's work has been featured on leading investment platforms, including TipRanks, InvestorPlace, Barchart, Benzinga, and Fintel. He was also handpicked to spearhead high-impact initiatives such as InvestorPlace's "Trade of the Day" and Benzinga’s ETF coverage. As a frequent guest expert for CGTN America, Joshua discusses a wide range of economic, societal, and consumer market trends. A graduate of U.C. San Diego, Joshua brings a thoughtful and fresh perspective to complex financial narratives, helping enterprise clients connect with their audiences. He also composes music in his spare time.

Join over 1.2M+ investors/traders who receive daily and weekly notable earnings alerts with predicted move