ajax loader

Loading...


Ride-the-Wave Strategy – Best for Stock Traders

Ride-the-Wave targets multi-day price momentum following a company’s earnings announcement (EA). With this strategy:

  1. Buy a stock one day post-EA if a stock reacts positively post-earnings:
    1. Near the close of trading the EA-day for a pre-market-EA
    2. Near the close of the following day for a post-market-EA
  2. Sell-to-close after 7-10 days, or possibly earlier if a desired price target is reached

Similarly,

  1. short a stock one day post-EA if a stock reacts negatively post-earnings:
    1. near the close of trading the EA-day for a premarket-EA
    2. near the close of the following day for a post-market-EA
  2. then buy-to-close after 7-10 days, or possibly earlier if a desired price target is reached

Important: Ride-the-Wave is predicated on significant price momentum triggered by an EA. The 7-10 day scenario is the maximum trade hold-time. If you see post EA-momentum is halted or reversed by a significant opposite move, re-evaluate your presence in the trade.

This popular StockEarnings screen below will give you a list of stocks that historically exhibit significant price momentum following an EA for the next seven days:

  1. Stocks exhibiting positive post-EA price moves are buy-candidates
  2. Stocks exhibiting negative post-EA price moves are sell/short-candidates

The screen includes those stocks whose Earnings just came out in last two days.

Screen criteria:

  1. Earnings Date Start Date : Current Date + -1 Day
  2. Earnings Date End Date : Current Date + -2 Days
  3. Predicted Move (Next Day) Max : 7%
  4. Predicted Move (On 7th Day) Min : 7%

Strategy Guideline:

  1. Buy the stock if stock has reacted positively. Short the stock if stock has reacted negatively (see above).
  2. Close the position in 7-10 days, or possibly earlier based on price move.

Volatility Crush Strategy - Best for Options Traders

The Volatility Crush strategy is used with stocks that typically experience relatively low-to-moderate price moves (≤4%) following their Earnings Announcements (EA). The basic trade idea is to sell put or call options right before the EA, collecting a credit when options premium is very high due to elevated implied volatility (IV). You then close the position right after the EA by buying the option back much cheaper due to the significant drop in IV that occurs after the mystery of the EA disappears. In assessing this trade, you need to do your homework to ensure you collect sufficient premium to make the trade worthwhile.

This trade is practical due to the low-to-moderate price-move after the EA, which generally won’t significantly affect the options price, unlike an “action” stock, which experience great price moves post-EA. With these symbols, if you’re on the right side of the price move, that’s a great thing. But if you’re on the wrong side of the move, not so great. Consequently, by minimizing the effect of the post-EA price move, you have a much better chance to profit from the reduction in IV without it being ruined by a violent price move.

For this trade, open the position either (1) the night before the EA when the company announces earnings or (2) during the EA day when it announces post-market, generally capturing IV at or close to its peak.

For this trade, open the position either (1) the night before the EA when the company announces earnings or (2) during the EA day when it announces post-market, generally capturing IV at or close to its peak.

This popular stockearnings screen will give you a list of stocks which do not react more than 4% fpost-EA. It includes only those stocks whose earnings are releasing next day.

Screen criteria:

  1. Earnings Date Start Date : Current Date + 1
  2. Earnings Date End Date : Current Date + 1
  3. Predicted Move (Next Day) Max : 4%
  4. Options Type: Weekly

Strategy Guideline:

  1. Options Strategy: Sell Call and Put
  2. Options Strike Price: Current Stock Price – (% Predicated Move x 2)
  3. Expiration Date: It should generally be the closest expiry immediately after the EA.
  4. Buy Insurance: Buying back Call and Put at Strike price which 10% lower than Sell Strike Price is optional but recommended.

Watch Video for More Detail

Volatility Rush Strategy - Best for Options Traders

The Volatility Rush takes advantage of increasing options premiums into earnings announcements (EA) caused by an anticipated rise in Implied Volatility (IV). With this strategy, Buy a Call and Put at-the-money (a long straddle) 2-3 weeks before the EA when IV is lower. Sell the position either (1) the night before the EA when the company announces earnings pre-market, or (2) during the EA day when it announces post-market, generally capturing IV at or close to its peak.

This popular screen will give you a list of stocks whose Options premiums tend to rise into Earnings. It includes only those stocks whose Earnings are at least two weeks away from today.

Screen criteria:

  1. Earnings Date Start Date : Current Date + 15 Days
  2. Earnings Date End Date : Current Date + 30 Days
  3. Predicted Move (Next Day) Min : 5%
  4. Options Type: Weekly or Monthly if that lines up with the two to three-week lead-time for entering the trade

Strategy Guideline:

  1. Buy a Straddle at or close to the money two to three weeks pre-EA.
  2. Sell the position either the night before the EA when the company announces earnings pre-market, or during the EA day when it announces post-market.
  3. Expiration date should generally be the closest expiry immediately after the EA.
  4. Straddle price should not be more 60% of predicted move.

Predicted Move (Volatility)

Similar to Implied Volatility in Options. Expected volatility % based on our Proprietary Volatility Predication Model. We are expecting that stock price will likely to reach % in either direction by the end of next trading session after Earnings are released and not necessarily the closing volatility %.

Why is it important?

    This indicator helps

  1. Knowing expected volatility in stocks after Earnings helps to decide trading stocks before Earnings Announcement.
  2. Taking Advantage of volatility collapse following Earnings Results by using Advance Options strategies such as Spread and Straddles.

Since Last Earnings

Change in share price since last Earnings release.

Why is it Important?

When share has gained more than 10% since it's last Earning release, it tends to over react to minor bad news and give up some gains if not all. So, it contains more downside volatility than upside When share has dropped more than 10% since it's last Earning release, it tends to over react to minor good news and recover some drops if not all. So, it contains more upside volatility than downside.

EPS Surprise (%)

Occurs when a company's reported quarterly or annual profits are above or below analysts' expectations. Here is the formula to derive % EPS Surprice:

Actual EPS - Estimated EPS
------------------------------------- x 100
Estimated EPS

Why is it Important?

Earnings surprises can have a huge impact on a company's stock price. Several studies suggest that positive earnings surprises not only lead to an immediate hike in a stock's price, but also to a gradual increase over time. Hence, it's not surprising that some companies are known for routinely beating earning projections. A negative earnings surprise will usually result in a decline in share price.

Next Day Price Change (%)

Next Regular trading session Closing price following Earnings result.

For After Market Close Earnings, It is a next trading day closing price. For Before Market Open Earnings, It is the same trading day closing price.

Why is it Important?

Next Day price change is a reaction of Earnings result.

Copper’s Perfect Storm Could Create Major Opportunity for Investors

Posted on Jun 22, 2026 by Ian Cooper

Copper’s Perfect Storm Could Create Major Opportunity for Investors

Copper is quickly becoming one of the biggest long-term investment stories in the market. Driven by accelerating demand from artificial intelligence, electric vehicles, renewable energy infrastructure, and the ongoing digital transformation of the global economy, the red metal is facing a supply-demand imbalance that could last for years.

The problem is there’s too much demand, and not enough supply.

Here’s why there’s concern.

While copper has always been a critical industrial metal, emerging technologies are creating an entirely new level of demand that many analysts believe the industry is unprepared to meet.

One of the biggest catalysts is the rapid expansion of artificial intelligence data centers.

BHP estimates that copper consumption from data centers alone could increase six-fold by 2050, rising from roughly 500,000 tonnes annually today to approximately 3 million tonnes per year. To put that into perspective, the additional copper required would be roughly equal to the combined annual production of the world’s four largest copper mines.

Not helping, the U.S. Department of Energy projects that data centers could account for up to 12% of total U.S. electricity demand by 2028. Some hyperscale facilities are expected to consume more than one gigawatt of power each, enough electricity to power hundreds of thousands of homes.

Every layer of that infrastructure requires copper. 


From transformers and switchgear to wiring, busbars, substations, and grid expansion projects, copper remains one of the most essential materials for moving and managing electricity efficiently. At the same time, demand from electric vehicles and renewable energy projects continues to expand. Bloomberg NEF estimates that the copper industry may require as much as $1.2 trillion in investment over the next 25 years simply to supply enough copper to meet future demand.

Unfortunately, supply growth may not keep pace.

Legendary resource investor Rick Rule recently pointed out that there is “zero doubt” copper supplies will decline over the next five years. His concerns center around the mining industry’s inability to rapidly bring new projects online.

Unlike many commodities, copper mining projects often require 10 to 15 years from discovery to commercial production. The mines needed to satisfy demand later this decade would have required major capital commitments more than a decade ago. Today, lengthy permitting processes, environmental regulations, and rising development costs are creating additional obstacles for new production.

Adding to the bullish outlook… 

Copper markets are already showing signs of strain. According to Mining.com, copper has entered a period of historic backwardation, a condition where near-term prices trade above future contracts. This typically signals immediate supply shortages and strong demand.

Wall Street is also becoming increasingly optimistic.

Analysts at Citi recently forecast that copper could rally to $12,000 per metric ton over the next six to 12 months. The firm cited unprecedented mine disruptions, resilient demand, and supportive macroeconomic conditions as key drivers behind its bullish outlook.

So, what’s the best way to trade potential upside in copper?

For investors looking to capitalize on the trend, copper mining stocks and exchange-traded funds may offer attractive exposure.

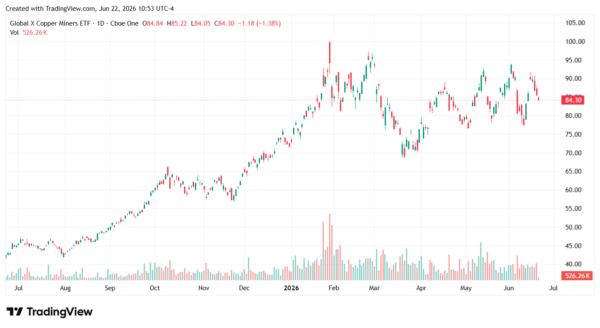
One option is the Global X Copper Miners ETF (NYSEARCA: COPX)

The fund provides diversified exposure to approximately 40 copper-related companies from around the world. Major holdings include Lundin Mining, Glencore, Southern Copper, BHP Group, Freeport-McMoRan, Ero Copper, and Taseko Mines.

The ETF has already delivered strong performance. After bottoming near $30.60 in April, shares recently climbed to approximately $85.50 as investor enthusiasm for copper and critical minerals strengthened.

copper-StockEarnings

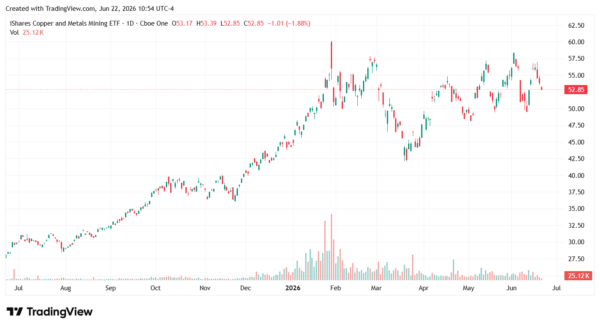
There’s also the iShares Copper and Metals Mining ETF (NASDAQ: ICOP).

With an expense ratio of 0.47%, the ICOP ETF offers exposure to global copper and metal ore miners, such as Anglo American, BHP Group, Freeport-McMoRan, Newmont, Lundin Mining, and Teck Resources, to name a few.

copper-StockEarnings

CONCLUSION

In short, copper is shaping up to be one of the defining commodities of the next decade. The combination of structurally rising demand from AI infrastructure, electrification, and grid modernization collides with a supply pipeline that is slow, expensive, and increasingly difficult to expand. That imbalance is exactly what has historically driven major commodity cycles.

Over the last 26 years, he’s taught thousands of investors how to trade news flow and herd mentality using a unique blend of technical and fundamental analysis. Cooper was among the few analysts to spot the financial crisis of 2008, the top of subprime and Alt-A, the death of Lehman Brothers, Bear Stearns, and New Century Financial, and even the Dow’s collapse to 6,500, as well as its recovery. He even called for gold to rally well above $1.500 when it traded under $600. At the moment, Cooper makes use of technical, fundamental and news analysis, to help individual investors grow their wealth. He’s a firm believer that hard work and thorough research will lead to investment success.

Join over 1.2M+ investors/traders who receive daily and weekly notable earnings alerts with predicted move