ajax loader

Loading...


Ride-the-Wave Strategy – Best for Stock Traders

Ride-the-Wave targets multi-day price momentum following a company’s earnings announcement (EA). With this strategy:

  1. Buy a stock one day post-EA if a stock reacts positively post-earnings:
    1. Near the close of trading the EA-day for a pre-market-EA
    2. Near the close of the following day for a post-market-EA
  2. Sell-to-close after 7-10 days, or possibly earlier if a desired price target is reached

Similarly,

  1. short a stock one day post-EA if a stock reacts negatively post-earnings:
    1. near the close of trading the EA-day for a premarket-EA
    2. near the close of the following day for a post-market-EA
  2. then buy-to-close after 7-10 days, or possibly earlier if a desired price target is reached

Important: Ride-the-Wave is predicated on significant price momentum triggered by an EA. The 7-10 day scenario is the maximum trade hold-time. If you see post EA-momentum is halted or reversed by a significant opposite move, re-evaluate your presence in the trade.

This popular StockEarnings screen below will give you a list of stocks that historically exhibit significant price momentum following an EA for the next seven days:

  1. Stocks exhibiting positive post-EA price moves are buy-candidates
  2. Stocks exhibiting negative post-EA price moves are sell/short-candidates

The screen includes those stocks whose Earnings just came out in last two days.

Screen criteria:

  1. Earnings Date Start Date : Current Date + -1 Day
  2. Earnings Date End Date : Current Date + -2 Days
  3. Predicted Move (Next Day) Max : 7%
  4. Predicted Move (On 7th Day) Min : 7%

Strategy Guideline:

  1. Buy the stock if stock has reacted positively. Short the stock if stock has reacted negatively (see above).
  2. Close the position in 7-10 days, or possibly earlier based on price move.

Volatility Crush Strategy - Best for Options Traders

The Volatility Crush strategy is used with stocks that typically experience relatively low-to-moderate price moves (≤4%) following their Earnings Announcements (EA). The basic trade idea is to sell put or call options right before the EA, collecting a credit when options premium is very high due to elevated implied volatility (IV). You then close the position right after the EA by buying the option back much cheaper due to the significant drop in IV that occurs after the mystery of the EA disappears. In assessing this trade, you need to do your homework to ensure you collect sufficient premium to make the trade worthwhile.

This trade is practical due to the low-to-moderate price-move after the EA, which generally won’t significantly affect the options price, unlike an “action” stock, which experience great price moves post-EA. With these symbols, if you’re on the right side of the price move, that’s a great thing. But if you’re on the wrong side of the move, not so great. Consequently, by minimizing the effect of the post-EA price move, you have a much better chance to profit from the reduction in IV without it being ruined by a violent price move.

For this trade, open the position either (1) the night before the EA when the company announces earnings or (2) during the EA day when it announces post-market, generally capturing IV at or close to its peak.

For this trade, open the position either (1) the night before the EA when the company announces earnings or (2) during the EA day when it announces post-market, generally capturing IV at or close to its peak.

This popular stockearnings screen will give you a list of stocks which do not react more than 4% fpost-EA. It includes only those stocks whose earnings are releasing next day.

Screen criteria:

  1. Earnings Date Start Date : Current Date + 1
  2. Earnings Date End Date : Current Date + 1
  3. Predicted Move (Next Day) Max : 4%
  4. Options Type: Weekly

Strategy Guideline:

  1. Options Strategy: Sell Call and Put
  2. Options Strike Price: Current Stock Price – (% Predicated Move x 2)
  3. Expiration Date: It should generally be the closest expiry immediately after the EA.
  4. Buy Insurance: Buying back Call and Put at Strike price which 10% lower than Sell Strike Price is optional but recommended.

Watch Video for More Detail

Volatility Rush Strategy - Best for Options Traders

The Volatility Rush takes advantage of increasing options premiums into earnings announcements (EA) caused by an anticipated rise in Implied Volatility (IV). With this strategy, Buy a Call and Put at-the-money (a long straddle) 2-3 weeks before the EA when IV is lower. Sell the position either (1) the night before the EA when the company announces earnings pre-market, or (2) during the EA day when it announces post-market, generally capturing IV at or close to its peak.

This popular screen will give you a list of stocks whose Options premiums tend to rise into Earnings. It includes only those stocks whose Earnings are at least two weeks away from today.

Screen criteria:

  1. Earnings Date Start Date : Current Date + 15 Days
  2. Earnings Date End Date : Current Date + 30 Days
  3. Predicted Move (Next Day) Min : 5%
  4. Options Type: Weekly or Monthly if that lines up with the two to three-week lead-time for entering the trade

Strategy Guideline:

  1. Buy a Straddle at or close to the money two to three weeks pre-EA.
  2. Sell the position either the night before the EA when the company announces earnings pre-market, or during the EA day when it announces post-market.
  3. Expiration date should generally be the closest expiry immediately after the EA.
  4. Straddle price should not be more 60% of predicted move.

Predicted Move (Volatility)

Similar to Implied Volatility in Options. Expected volatility % based on our Proprietary Volatility Predication Model. We are expecting that stock price will likely to reach % in either direction by the end of next trading session after Earnings are released and not necessarily the closing volatility %.

Why is it important?

    This indicator helps

  1. Knowing expected volatility in stocks after Earnings helps to decide trading stocks before Earnings Announcement.
  2. Taking Advantage of volatility collapse following Earnings Results by using Advance Options strategies such as Spread and Straddles.

Since Last Earnings

Change in share price since last Earnings release.

Why is it Important?

When share has gained more than 10% since it's last Earning release, it tends to over react to minor bad news and give up some gains if not all. So, it contains more downside volatility than upside When share has dropped more than 10% since it's last Earning release, it tends to over react to minor good news and recover some drops if not all. So, it contains more upside volatility than downside.

EPS Surprise (%)

Occurs when a company's reported quarterly or annual profits are above or below analysts' expectations. Here is the formula to derive % EPS Surprice:

Actual EPS - Estimated EPS
------------------------------------- x 100
Estimated EPS

Why is it Important?

Earnings surprises can have a huge impact on a company's stock price. Several studies suggest that positive earnings surprises not only lead to an immediate hike in a stock's price, but also to a gradual increase over time. Hence, it's not surprising that some companies are known for routinely beating earning projections. A negative earnings surprise will usually result in a decline in share price.

Next Day Price Change (%)

Next Regular trading session Closing price following Earnings result.

For After Market Close Earnings, It is a next trading day closing price. For Before Market Open Earnings, It is the same trading day closing price.

Why is it Important?

Next Day price change is a reaction of Earnings result.

Micron Crushes Estimates as AI Memory Demand Explodes

Posted on Jun 25, 2026 by Ian Cooper

Micron Crushes Estimates as AI Memory Demand Explodes

Micron Technology (NASDAQ: MU) is exploding higher after the memory-chip giant delivered another blockbuster earnings report, fueled by unprecedented demand for artificial intelligence infrastructure, which shows no clear signs of cooling off.

In addition, with AI data centers consuming massive amounts of high-bandwidth memory (HBM), MU has become one of the biggest beneficiaries of the boom, posting revenue and profit growth that far exceeded Wall Street expectations. 

However, while investors are cheering results and bullish guidance, history suggests caution.

Let’s start out with the good news. 

Micron’s AI-Fueled Growth Is Accelerating


Micron’s adjusted EPS of $25.11 was well above estimates of $20.78. Revenue of $41.46 billion was also well above estimates of $35.84 billion. Revenue was also well above the $9.3 billion posted year over year. For the current quarter, MU expects to see revenue of about $50 billion, which would be another massive year over year jump from $11.3 billion.

In addition, as noted by CNBC, “While all four of Micron’s business units saw revenue multiply, the most explosive growth was in the core data center business, where sales climbed more than sevenfold to $11.5 billion from $1.53 billion in the same period a year ago. In addition to memory, Micron also recorded over $5 billion in data center solid state drive revenue.”

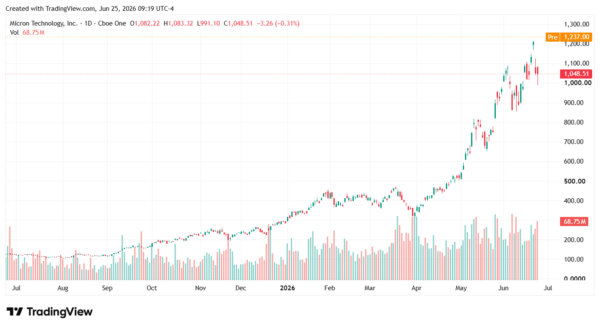
That explosive growth explains why shares of MU surged about 15% in after-hours trading. From here, as long as demand for memory chips continues to outpace available supply, MU could have room to push even higher.

micron-StockEarnings

Why Investors Shouldn’t Ignore Industry Risks

Fueled by surging demand for AI infrastructure, data centers, and high-bandwidth memory solutions, MU has emerged as one of the semiconductor industry’s biggest winners. The company’s advanced DRAM and NAND memory products have become critical components in AI servers, helping drive significant revenue growth and investor enthusiasm.

But the good times could come to an end once production increases, especially as Samsung and SK Hynix build new fabrication plants to boost production capacity. When that happens, and when supply again overtakes demand, stocks like Micron could easily reverse lower. History is also proof investors should be cautious. Between 2022 and 2023, the memory crash led to MU reporting a GAAP net loss of $2.31 billion in just one quarter, as noted by Trefis. 

“During 2018 and 2019, cloud operators over-ordered memory through 2017, then steadily reduced purchases through 2018 as inventories swelled. NAND prices fell roughly 60% and DRAM approximately 40%. Micron peaked near $64 in May 2018 and fell to around $28 by year-end,” they added.

Where Micron Goes From Here

Micron is one of the biggest winners of the AI infrastructure boom.

Demand for advanced memory solutions continues to accelerate as hyper scalers, cloud providers, and AI developers race to expand computing capacity. All of which could support further gains in MU stock, especially if supply remains constrained and pricing stays strong.

However, today’s shortages and soaring prices could eventually give way to oversupply and falling margins as competitors ramp production. While Micron’s latest earnings report reinforces the strength of what’s happening, long-term investors should keep a close eye on industry capacity. Once that improves, Micron could start to fall apart.

Over the last 26 years, he’s taught thousands of investors how to trade news flow and herd mentality using a unique blend of technical and fundamental analysis. Cooper was among the few analysts to spot the financial crisis of 2008, the top of subprime and Alt-A, the death of Lehman Brothers, Bear Stearns, and New Century Financial, and even the Dow’s collapse to 6,500, as well as its recovery. He even called for gold to rally well above $1.500 when it traded under $600. At the moment, Cooper makes use of technical, fundamental and news analysis, to help individual investors grow their wealth. He’s a firm believer that hard work and thorough research will lead to investment success.

Join over 1.2M+ investors/traders who receive daily and weekly notable earnings alerts with predicted move