ajax loader

Loading...


Ride-the-Wave Strategy – Best for Stock Traders

Ride-the-Wave targets multi-day price momentum following a company’s earnings announcement (EA). With this strategy:

  1. Buy a stock one day post-EA if a stock reacts positively post-earnings:
    1. Near the close of trading the EA-day for a pre-market-EA
    2. Near the close of the following day for a post-market-EA
  2. Sell-to-close after 7-10 days, or possibly earlier if a desired price target is reached

Similarly,

  1. short a stock one day post-EA if a stock reacts negatively post-earnings:
    1. near the close of trading the EA-day for a premarket-EA
    2. near the close of the following day for a post-market-EA
  2. then buy-to-close after 7-10 days, or possibly earlier if a desired price target is reached

Important: Ride-the-Wave is predicated on significant price momentum triggered by an EA. The 7-10 day scenario is the maximum trade hold-time. If you see post EA-momentum is halted or reversed by a significant opposite move, re-evaluate your presence in the trade.

This popular StockEarnings screen below will give you a list of stocks that historically exhibit significant price momentum following an EA for the next seven days:

  1. Stocks exhibiting positive post-EA price moves are buy-candidates
  2. Stocks exhibiting negative post-EA price moves are sell/short-candidates

The screen includes those stocks whose Earnings just came out in last two days.

Screen criteria:

  1. Earnings Date Start Date : Current Date + -1 Day
  2. Earnings Date End Date : Current Date + -2 Days
  3. Predicted Move (Next Day) Max : 7%
  4. Predicted Move (On 7th Day) Min : 7%

Strategy Guideline:

  1. Buy the stock if stock has reacted positively. Short the stock if stock has reacted negatively (see above).
  2. Close the position in 7-10 days, or possibly earlier based on price move.

Volatility Crush Strategy - Best for Options Traders

The Volatility Crush strategy is used with stocks that typically experience relatively low-to-moderate price moves (≤4%) following their Earnings Announcements (EA). The basic trade idea is to sell put or call options right before the EA, collecting a credit when options premium is very high due to elevated implied volatility (IV). You then close the position right after the EA by buying the option back much cheaper due to the significant drop in IV that occurs after the mystery of the EA disappears. In assessing this trade, you need to do your homework to ensure you collect sufficient premium to make the trade worthwhile.

This trade is practical due to the low-to-moderate price-move after the EA, which generally won’t significantly affect the options price, unlike an “action” stock, which experience great price moves post-EA. With these symbols, if you’re on the right side of the price move, that’s a great thing. But if you’re on the wrong side of the move, not so great. Consequently, by minimizing the effect of the post-EA price move, you have a much better chance to profit from the reduction in IV without it being ruined by a violent price move.

For this trade, open the position either (1) the night before the EA when the company announces earnings or (2) during the EA day when it announces post-market, generally capturing IV at or close to its peak.

For this trade, open the position either (1) the night before the EA when the company announces earnings or (2) during the EA day when it announces post-market, generally capturing IV at or close to its peak.

This popular stockearnings screen will give you a list of stocks which do not react more than 4% fpost-EA. It includes only those stocks whose earnings are releasing next day.

Screen criteria:

  1. Earnings Date Start Date : Current Date + 1
  2. Earnings Date End Date : Current Date + 1
  3. Predicted Move (Next Day) Max : 4%
  4. Options Type: Weekly

Strategy Guideline:

  1. Options Strategy: Sell Call and Put
  2. Options Strike Price: Current Stock Price – (% Predicated Move x 2)
  3. Expiration Date: It should generally be the closest expiry immediately after the EA.
  4. Buy Insurance: Buying back Call and Put at Strike price which 10% lower than Sell Strike Price is optional but recommended.

Watch Video for More Detail

Volatility Rush Strategy - Best for Options Traders

The Volatility Rush takes advantage of increasing options premiums into earnings announcements (EA) caused by an anticipated rise in Implied Volatility (IV). With this strategy, Buy a Call and Put at-the-money (a long straddle) 2-3 weeks before the EA when IV is lower. Sell the position either (1) the night before the EA when the company announces earnings pre-market, or (2) during the EA day when it announces post-market, generally capturing IV at or close to its peak.

This popular screen will give you a list of stocks whose Options premiums tend to rise into Earnings. It includes only those stocks whose Earnings are at least two weeks away from today.

Screen criteria:

  1. Earnings Date Start Date : Current Date + 15 Days
  2. Earnings Date End Date : Current Date + 30 Days
  3. Predicted Move (Next Day) Min : 5%
  4. Options Type: Weekly or Monthly if that lines up with the two to three-week lead-time for entering the trade

Strategy Guideline:

  1. Buy a Straddle at or close to the money two to three weeks pre-EA.
  2. Sell the position either the night before the EA when the company announces earnings pre-market, or during the EA day when it announces post-market.
  3. Expiration date should generally be the closest expiry immediately after the EA.
  4. Straddle price should not be more 60% of predicted move.

Predicted Move (Volatility)

Similar to Implied Volatility in Options. Expected volatility % based on our Proprietary Volatility Predication Model. We are expecting that stock price will likely to reach % in either direction by the end of next trading session after Earnings are released and not necessarily the closing volatility %.

Why is it important?

    This indicator helps

  1. Knowing expected volatility in stocks after Earnings helps to decide trading stocks before Earnings Announcement.
  2. Taking Advantage of volatility collapse following Earnings Results by using Advance Options strategies such as Spread and Straddles.

Since Last Earnings

Change in share price since last Earnings release.

Why is it Important?

When share has gained more than 10% since it's last Earning release, it tends to over react to minor bad news and give up some gains if not all. So, it contains more downside volatility than upside When share has dropped more than 10% since it's last Earning release, it tends to over react to minor good news and recover some drops if not all. So, it contains more upside volatility than downside.

EPS Surprise (%)

Occurs when a company's reported quarterly or annual profits are above or below analysts' expectations. Here is the formula to derive % EPS Surprice:

Actual EPS - Estimated EPS
------------------------------------- x 100
Estimated EPS

Why is it Important?

Earnings surprises can have a huge impact on a company's stock price. Several studies suggest that positive earnings surprises not only lead to an immediate hike in a stock's price, but also to a gradual increase over time. Hence, it's not surprising that some companies are known for routinely beating earning projections. A negative earnings surprise will usually result in a decline in share price.

Next Day Price Change (%)

Next Regular trading session Closing price following Earnings result.

For After Market Close Earnings, It is a next trading day closing price. For Before Market Open Earnings, It is the same trading day closing price.

Why is it Important?

Next Day price change is a reaction of Earnings result.

Can Qualcomm’s Data Center Push Drive Higher Valuation?

Posted on Jun 25, 2026 by Chris Markoch

Can Qualcomm’s Data Center Push Drive Higher Valuation?

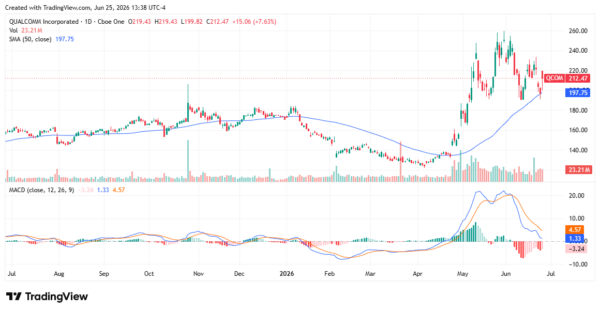
Qualcomm Incorporated (NASDAQ: QCOM) jumped more than 7% on June 25, 2026. Wall Street is digesting a fresh set of AI-related catalysts from the chipmaker’s Investor Day. The move continues a pattern of sharp swings that has defined QCOM stock for most of 2026. Shares have traded from the low $140s in spring to the high $250s in May before retreating again.

At roughly $212 per share, Qualcomm trades around 26 times trailing earnings. That sits well below AI infrastructure peers like Broadcom (NASDAQ: AVGO) and NVIDIA (NASDAQ: NVDA). For long-term investors, the question is whether QCOM is a mispriced AI data center story finally breaking out of its smartphone shell.

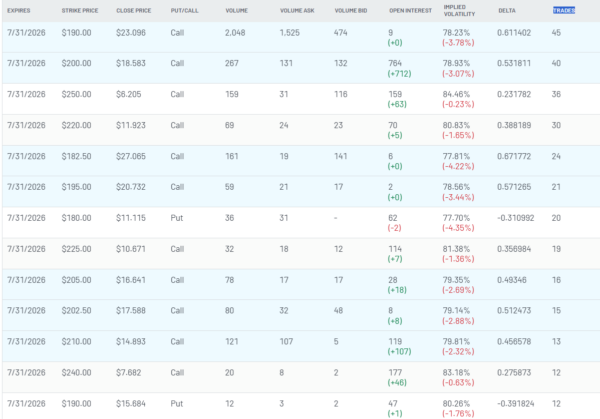
For short-term traders, the question is very different. The July 31, 2026, options chain shows implied volatility running between 78% and 84% across most strikes. Heavy call interest extends as far up as $250, with active put positioning below $190. That expiration falls just days after Qualcomm’s expected fiscal Q3 earnings release, which TipRanks currently pegs for August 5, 2026.

The combination of a transformational Investor Day, a near-term earnings catalyst, and a six-month trading range of nearly 90 points makes QCOM one of the more interesting setups in the semiconductor group right now.

Why Qualcomm’s Data Center Pivot Could Re-Rate the Stock


At its June 24 Investor Day, Qualcomm raised its fiscal 2029 non-handset revenue target to $40 billion, roughly double its prior guidance. The company also set a data center revenue target of more than $15 billion by fiscal 2029.

Meta Platforms (NASDAQ: META) was disclosed as a multi-generational customer for the forthcoming Dragonfly C1000 CPU. Microsoft’s (NASDAQ: MSFT) Azure cloud unit has been tapped for the High Bandwidth Compute chip architecture, slated for mid-2027.

For a business that still draws roughly two-thirds of product revenue from smartphones, that mix shift is significant. Qualcomm also targets $10 billion in automotive revenue, more than $14 billion in IoT revenue, and non-GAAP earnings per share of more than $18 by fiscal 2029. Analysts polled by LSEG currently model fiscal 2029 EPS of $15.26, which means Qualcomm’s own targets are nearly 18% above consensus.

The strategy extends beyond merchant silicon. Qualcomm reported two major hyperscaler custom-silicon wins, each expected to exceed one billion dollars in fiscal 2027. The Modular acquisition, while dilutive, addresses Qualcomm’s historic software gap relative to Nvidia’s CUDA ecosystem.

The Chart Says Conviction Has Yet to Return

Despite Wednesday’s rally, the QCOM chart shows signs of indecision. The stock peaked near $260 in May and has been carving lower highs and lower lows since. The 50-day simple moving average at $197.75 has acted as a battleground rather than a launchpad. Friday’s surge took shares back above that level on volume of more than 23 million.

The MACD indicator, however, remains bearish on a daily basis. The MACD line at 1.33 sits below the signal line at 4.57. The histogram is negative at -3.24. That configuration typically suggests momentum has not yet flipped back in favor of the bulls, even with the strong intraday move.

qualcomm - StockEarnings

Options traders appear to be positioning for sharp movement in either direction. The July 31 expiration shows implied volatility above 78% across the call chain and similar levels on puts. The largest open interest in the high-volume calls sits near the $200 strike, with active put hedging at $190 and $180. That pricing implies an expected move of roughly 12% to 15% through expiration. Traders are clearly bracing for an outsized reaction to the August earnings print.

qualcomm - StockEarnings

The Bear Case: Why 26x Earnings May Still Be Right

The skeptical view starts with timing. The Dragonfly C1000 microprocessor will be available in 2028. That means none of Meta or Microsoft’s revenue will contribute meaningfully to the next two fiscal years. The all-stock Modular acquisition is valued at $3.92 billion and is expected to close in the second half of 2026, introducing near-term dilution that hits earnings now rather than later.

Smartphone exposure remains the dominant near-term variable. Management guided fiscal Q3 revenue of $9.2 billion to $10.0 billion and non-GAAP EPS of $2.10 to $2.30. Both numbers sit below the company’s fiscal Q2 results of $10.6 billion and $2.65. CEO Cristiano Amon has said China handset shipments should bottom in Q3 before recovering, but memory price inflation continues to pressure Chinese OEMs.

Competition is also intensifying. Broadcom reported $10.8 billion in AI-related revenue in its most recent quarter, up 143% year over year, while Marvell is guiding to 40% growth for the current year. Even Intel and AMD have server CPUs with core counts comparable to Dragonfly’s 250-plus design, and those parts ship years before Qualcomm’s.

Bottom Line: The Setup Favors Patience, Not Conviction

Qualcomm has given long-term investors a credible bull case. Real customer commitments from Meta and Microsoft, ambitious financial targets above current consensus, and a software acquisition that addresses a known weakness all support the thesis. The stock still trades at a discount to AI infrastructure peers, which keeps the “undervalued” framing in play.

The bear case is just as easy to assemble. Data center revenue is years away, the Modular deal is dilutive, and smartphones remain the swing factor for the next several quarters. With earnings on the calendar in early August and options markets pricing in a double-digit percentage move, QCOM is likely to keep behaving more like a trader’s vehicle than a buy-and-hold compounder in the near term.

A former marketing copywriter turned freelance financial writer and market analyst. I have a passion for delivering insights to investors. I write regularly about stocks for StockEarnings and MarketBeat. Posts are not advice.

Join over 1.2M+ investors/traders who receive daily and weekly notable earnings alerts with predicted move