ajax loader

Loading...


Ride-the-Wave Strategy – Best for Stock Traders

Ride-the-Wave targets multi-day price momentum following a company’s earnings announcement (EA). With this strategy:

  1. Buy a stock one day post-EA if a stock reacts positively post-earnings:
    1. Near the close of trading the EA-day for a pre-market-EA
    2. Near the close of the following day for a post-market-EA
  2. Sell-to-close after 7-10 days, or possibly earlier if a desired price target is reached

Similarly,

  1. short a stock one day post-EA if a stock reacts negatively post-earnings:
    1. near the close of trading the EA-day for a premarket-EA
    2. near the close of the following day for a post-market-EA
  2. then buy-to-close after 7-10 days, or possibly earlier if a desired price target is reached

Important: Ride-the-Wave is predicated on significant price momentum triggered by an EA. The 7-10 day scenario is the maximum trade hold-time. If you see post EA-momentum is halted or reversed by a significant opposite move, re-evaluate your presence in the trade.

This popular StockEarnings screen below will give you a list of stocks that historically exhibit significant price momentum following an EA for the next seven days:

  1. Stocks exhibiting positive post-EA price moves are buy-candidates
  2. Stocks exhibiting negative post-EA price moves are sell/short-candidates

The screen includes those stocks whose Earnings just came out in last two days.

Screen criteria:

  1. Earnings Date Start Date : Current Date + -1 Day
  2. Earnings Date End Date : Current Date + -2 Days
  3. Predicted Move (Next Day) Max : 7%
  4. Predicted Move (On 7th Day) Min : 7%

Strategy Guideline:

  1. Buy the stock if stock has reacted positively. Short the stock if stock has reacted negatively (see above).
  2. Close the position in 7-10 days, or possibly earlier based on price move.

Volatility Crush Strategy - Best for Options Traders

The Volatility Crush strategy is used with stocks that typically experience relatively low-to-moderate price moves (≤4%) following their Earnings Announcements (EA). The basic trade idea is to sell put or call options right before the EA, collecting a credit when options premium is very high due to elevated implied volatility (IV). You then close the position right after the EA by buying the option back much cheaper due to the significant drop in IV that occurs after the mystery of the EA disappears. In assessing this trade, you need to do your homework to ensure you collect sufficient premium to make the trade worthwhile.

This trade is practical due to the low-to-moderate price-move after the EA, which generally won’t significantly affect the options price, unlike an “action” stock, which experience great price moves post-EA. With these symbols, if you’re on the right side of the price move, that’s a great thing. But if you’re on the wrong side of the move, not so great. Consequently, by minimizing the effect of the post-EA price move, you have a much better chance to profit from the reduction in IV without it being ruined by a violent price move.

For this trade, open the position either (1) the night before the EA when the company announces earnings or (2) during the EA day when it announces post-market, generally capturing IV at or close to its peak.

For this trade, open the position either (1) the night before the EA when the company announces earnings or (2) during the EA day when it announces post-market, generally capturing IV at or close to its peak.

This popular stockearnings screen will give you a list of stocks which do not react more than 4% fpost-EA. It includes only those stocks whose earnings are releasing next day.

Screen criteria:

  1. Earnings Date Start Date : Current Date + 1
  2. Earnings Date End Date : Current Date + 1
  3. Predicted Move (Next Day) Max : 4%
  4. Options Type: Weekly

Strategy Guideline:

  1. Options Strategy: Sell Call and Put
  2. Options Strike Price: Current Stock Price – (% Predicated Move x 2)
  3. Expiration Date: It should generally be the closest expiry immediately after the EA.
  4. Buy Insurance: Buying back Call and Put at Strike price which 10% lower than Sell Strike Price is optional but recommended.

Watch Video for More Detail

Volatility Rush Strategy - Best for Options Traders

The Volatility Rush takes advantage of increasing options premiums into earnings announcements (EA) caused by an anticipated rise in Implied Volatility (IV). With this strategy, Buy a Call and Put at-the-money (a long straddle) 2-3 weeks before the EA when IV is lower. Sell the position either (1) the night before the EA when the company announces earnings pre-market, or (2) during the EA day when it announces post-market, generally capturing IV at or close to its peak.

This popular screen will give you a list of stocks whose Options premiums tend to rise into Earnings. It includes only those stocks whose Earnings are at least two weeks away from today.

Screen criteria:

  1. Earnings Date Start Date : Current Date + 15 Days
  2. Earnings Date End Date : Current Date + 30 Days
  3. Predicted Move (Next Day) Min : 5%
  4. Options Type: Weekly or Monthly if that lines up with the two to three-week lead-time for entering the trade

Strategy Guideline:

  1. Buy a Straddle at or close to the money two to three weeks pre-EA.
  2. Sell the position either the night before the EA when the company announces earnings pre-market, or during the EA day when it announces post-market.
  3. Expiration date should generally be the closest expiry immediately after the EA.
  4. Straddle price should not be more 60% of predicted move.

Predicted Move (Volatility)

Similar to Implied Volatility in Options. Expected volatility % based on our Proprietary Volatility Predication Model. We are expecting that stock price will likely to reach % in either direction by the end of next trading session after Earnings are released and not necessarily the closing volatility %.

Why is it important?

    This indicator helps

  1. Knowing expected volatility in stocks after Earnings helps to decide trading stocks before Earnings Announcement.
  2. Taking Advantage of volatility collapse following Earnings Results by using Advance Options strategies such as Spread and Straddles.

Since Last Earnings

Change in share price since last Earnings release.

Why is it Important?

When share has gained more than 10% since it's last Earning release, it tends to over react to minor bad news and give up some gains if not all. So, it contains more downside volatility than upside When share has dropped more than 10% since it's last Earning release, it tends to over react to minor good news and recover some drops if not all. So, it contains more upside volatility than downside.

EPS Surprise (%)

Occurs when a company's reported quarterly or annual profits are above or below analysts' expectations. Here is the formula to derive % EPS Surprice:

Actual EPS - Estimated EPS
------------------------------------- x 100
Estimated EPS

Why is it Important?

Earnings surprises can have a huge impact on a company's stock price. Several studies suggest that positive earnings surprises not only lead to an immediate hike in a stock's price, but also to a gradual increase over time. Hence, it's not surprising that some companies are known for routinely beating earning projections. A negative earnings surprise will usually result in a decline in share price.

Next Day Price Change (%)

Next Regular trading session Closing price following Earnings result.

For After Market Close Earnings, It is a next trading day closing price. For Before Market Open Earnings, It is the same trading day closing price.

Why is it Important?

Next Day price change is a reaction of Earnings result.

2 of the Best Ways to Profit from a Potential $5 Trillion Humanoid Market

Posted on Jun 26, 2026 by Ian Cooper

2 of the Best Ways to Profit from a Potential $5 Trillion Humanoid Market

Artificial intelligence is rapidly moving into the physical world, creating one of the biggest investment opportunities of the next several decades.

From warehouse automation and manufacturing to healthcare, logistics, and space exploration, humanoid robots are expected to transform the global economy.

Why Wall Street Is Bullish on Humanoid Robots


According to Morgan Stanley, the humanoid robotics market could generate nearly $5 trillion in annual revenue by 2050, making it one of the largest technological revolutions since the Internet. 

With Wall Street forecasting explosive growth in humanoid adoption over the next decade, investors are increasingly looking for the best stocks and ETFs positioned to benefit from the rise of physical AI and advanced robotics.

In addition, new estimates from Morgan Stanley analysts forecast $4.7 trillion in global humanoid revenue by 2050, which the firm said is double the total revenue of the 20 largest automakers in 2024. What’s more, while auto revenue could “very well shrink over the next 25 years,” analysts estimate that global humanoid adoption will accelerate and reach roughly 1 billion units by 2050, the investment bank said, as noted by CNBC.

Goldman Sachs says global humanoid robot demand potentially achieving a $38 billion total addressable market by 2035. Bank of America. believes global humanoid robot shipments will reach 18,000 units in 2025 and 10 million units by 2035.

And Wedbush analyst Dan says humanoid robots could be oneof the biggest opportunities in the AI boom. The market will be worth trillions of dollars over the next decade, Ives added, as noted by CNBC, and “will change the way consumers and businesses operate over time.”

How Humanoid Robots Could Transform the Economy

When that happens, humanoid robots could assist patients, assist with physical therapy and rehab exercises, reduce staffing shortages, automate demand tasks, assist with rescues, perform maintenance and operations in space, the list goes on.

The only question now is – how can we make money from it?

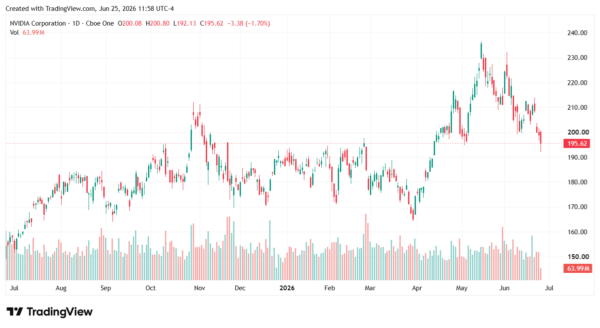
Nvidia Is Building the Infrastructure for Physical AI

NVIDIA (NASDAQ: NVDA) is now betting that the next major wave of artificial intelligence will exist in the Physical AI world by walking, moving, lifting boxes, operating machinery, and working with humans. 

Fueling momentum is Nvidia’s Halos for Robotics, which, according to the company, is the industry’s first, full-stack, open safety system for physical AI and robotics. The platform is designed to help robots and humanoids operate safely in human environments by combining AI computing software, including IGX Thor and the Holoscan Sensor Bridge for AI, with safety operating systems using Nvidia Halos OS. Even better, it’s already seeing early adoption.

humanoid-StockEarnings

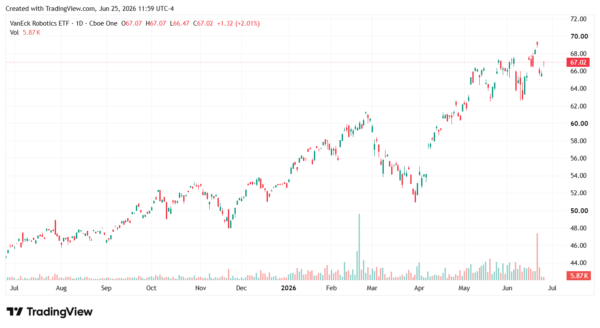
A Diversified Way to Invest in Robotics

There’s also the VanEck Robotics ETF (NASDAQ: IBOT). With an expense ratio of 0.47%, the fund replicates the price and yield performance of the BlueStar Robotics Index, which tracks companies involved with robotics and automation technologies. Some of its 67 holdings include Nvidia, ASML Holding, Siemens, Autodesk, and Teledyne Technologies.

The ETF offers investors diversified exposure to several key trends driving the robotics revolution, including artificial intelligence, industrial automation, machine vision, semiconductor manufacturing, and autonomous systems. That diversification can be especially attractive for investors who want exposure to the humanoid robotics boom without having to pick individual winners in what is still an emerging industry.

humanoid-StockEarnings

The Next Phase of AI Could Be Physical—Here’s How to Invest

As advances in artificial intelligence, sensors, and computing power continue to accelerate, humanoid robots could become as commonplace in the workplace as computers are today. For investors looking to gain exposure to this long-term trend, Nvidia offers a direct play on the AI infrastructure powering next-generation robotics, while the VanEck Robotics ETF provides diversified exposure to a broad basket of companies helping drive automation forward. 

If forecasts from Morgan Stanley, Goldman Sachs, and other Wall Street firms prove accurate, today’s investments in robotics and physical AI could get explosive.

Over the last 26 years, he’s taught thousands of investors how to trade news flow and herd mentality using a unique blend of technical and fundamental analysis. Cooper was among the few analysts to spot the financial crisis of 2008, the top of subprime and Alt-A, the death of Lehman Brothers, Bear Stearns, and New Century Financial, and even the Dow’s collapse to 6,500, as well as its recovery. He even called for gold to rally well above $1.500 when it traded under $600. At the moment, Cooper makes use of technical, fundamental and news analysis, to help individual investors grow their wealth. He’s a firm believer that hard work and thorough research will lead to investment success.

Join over 1.2M+ investors/traders who receive daily and weekly notable earnings alerts with predicted move