ajax loader

Loading...


Ride-the-Wave Strategy – Best for Stock Traders

Ride-the-Wave targets multi-day price momentum following a company’s earnings announcement (EA). With this strategy:

  1. Buy a stock one day post-EA if a stock reacts positively post-earnings:
    1. Near the close of trading the EA-day for a pre-market-EA
    2. Near the close of the following day for a post-market-EA
  2. Sell-to-close after 7-10 days, or possibly earlier if a desired price target is reached

Similarly,

  1. short a stock one day post-EA if a stock reacts negatively post-earnings:
    1. near the close of trading the EA-day for a premarket-EA
    2. near the close of the following day for a post-market-EA
  2. then buy-to-close after 7-10 days, or possibly earlier if a desired price target is reached

Important: Ride-the-Wave is predicated on significant price momentum triggered by an EA. The 7-10 day scenario is the maximum trade hold-time. If you see post EA-momentum is halted or reversed by a significant opposite move, re-evaluate your presence in the trade.

This popular StockEarnings screen below will give you a list of stocks that historically exhibit significant price momentum following an EA for the next seven days:

  1. Stocks exhibiting positive post-EA price moves are buy-candidates
  2. Stocks exhibiting negative post-EA price moves are sell/short-candidates

The screen includes those stocks whose Earnings just came out in last two days.

Screen criteria:

  1. Earnings Date Start Date : Current Date + -1 Day
  2. Earnings Date End Date : Current Date + -2 Days
  3. Predicted Move (Next Day) Max : 7%
  4. Predicted Move (On 7th Day) Min : 7%

Strategy Guideline:

  1. Buy the stock if stock has reacted positively. Short the stock if stock has reacted negatively (see above).
  2. Close the position in 7-10 days, or possibly earlier based on price move.

Volatility Crush Strategy - Best for Options Traders

The Volatility Crush strategy is used with stocks that typically experience relatively low-to-moderate price moves (≤4%) following their Earnings Announcements (EA). The basic trade idea is to sell put or call options right before the EA, collecting a credit when options premium is very high due to elevated implied volatility (IV). You then close the position right after the EA by buying the option back much cheaper due to the significant drop in IV that occurs after the mystery of the EA disappears. In assessing this trade, you need to do your homework to ensure you collect sufficient premium to make the trade worthwhile.

This trade is practical due to the low-to-moderate price-move after the EA, which generally won’t significantly affect the options price, unlike an “action” stock, which experience great price moves post-EA. With these symbols, if you’re on the right side of the price move, that’s a great thing. But if you’re on the wrong side of the move, not so great. Consequently, by minimizing the effect of the post-EA price move, you have a much better chance to profit from the reduction in IV without it being ruined by a violent price move.

For this trade, open the position either (1) the night before the EA when the company announces earnings or (2) during the EA day when it announces post-market, generally capturing IV at or close to its peak.

For this trade, open the position either (1) the night before the EA when the company announces earnings or (2) during the EA day when it announces post-market, generally capturing IV at or close to its peak.

This popular stockearnings screen will give you a list of stocks which do not react more than 4% fpost-EA. It includes only those stocks whose earnings are releasing next day.

Screen criteria:

  1. Earnings Date Start Date : Current Date + 1
  2. Earnings Date End Date : Current Date + 1
  3. Predicted Move (Next Day) Max : 4%
  4. Options Type: Weekly

Strategy Guideline:

  1. Options Strategy: Sell Call and Put
  2. Options Strike Price: Current Stock Price – (% Predicated Move x 2)
  3. Expiration Date: It should generally be the closest expiry immediately after the EA.
  4. Buy Insurance: Buying back Call and Put at Strike price which 10% lower than Sell Strike Price is optional but recommended.

Watch Video for More Detail

Volatility Rush Strategy - Best for Options Traders

The Volatility Rush takes advantage of increasing options premiums into earnings announcements (EA) caused by an anticipated rise in Implied Volatility (IV). With this strategy, Buy a Call and Put at-the-money (a long straddle) 2-3 weeks before the EA when IV is lower. Sell the position either (1) the night before the EA when the company announces earnings pre-market, or (2) during the EA day when it announces post-market, generally capturing IV at or close to its peak.

This popular screen will give you a list of stocks whose Options premiums tend to rise into Earnings. It includes only those stocks whose Earnings are at least two weeks away from today.

Screen criteria:

  1. Earnings Date Start Date : Current Date + 15 Days
  2. Earnings Date End Date : Current Date + 30 Days
  3. Predicted Move (Next Day) Min : 5%
  4. Options Type: Weekly or Monthly if that lines up with the two to three-week lead-time for entering the trade

Strategy Guideline:

  1. Buy a Straddle at or close to the money two to three weeks pre-EA.
  2. Sell the position either the night before the EA when the company announces earnings pre-market, or during the EA day when it announces post-market.
  3. Expiration date should generally be the closest expiry immediately after the EA.
  4. Straddle price should not be more 60% of predicted move.

Predicted Move (Volatility)

Similar to Implied Volatility in Options. Expected volatility % based on our Proprietary Volatility Predication Model. We are expecting that stock price will likely to reach % in either direction by the end of next trading session after Earnings are released and not necessarily the closing volatility %.

Why is it important?

    This indicator helps

  1. Knowing expected volatility in stocks after Earnings helps to decide trading stocks before Earnings Announcement.
  2. Taking Advantage of volatility collapse following Earnings Results by using Advance Options strategies such as Spread and Straddles.

Since Last Earnings

Change in share price since last Earnings release.

Why is it Important?

When share has gained more than 10% since it's last Earning release, it tends to over react to minor bad news and give up some gains if not all. So, it contains more downside volatility than upside When share has dropped more than 10% since it's last Earning release, it tends to over react to minor good news and recover some drops if not all. So, it contains more upside volatility than downside.

EPS Surprise (%)

Occurs when a company's reported quarterly or annual profits are above or below analysts' expectations. Here is the formula to derive % EPS Surprice:

Actual EPS - Estimated EPS
------------------------------------- x 100
Estimated EPS

Why is it Important?

Earnings surprises can have a huge impact on a company's stock price. Several studies suggest that positive earnings surprises not only lead to an immediate hike in a stock's price, but also to a gradual increase over time. Hence, it's not surprising that some companies are known for routinely beating earning projections. A negative earnings surprise will usually result in a decline in share price.

Next Day Price Change (%)

Next Regular trading session Closing price following Earnings result.

For After Market Close Earnings, It is a next trading day closing price. For Before Market Open Earnings, It is the same trading day closing price.

Why is it Important?

Next Day price change is a reaction of Earnings result.

Microsoft’s 48% Azure Growth Comes With a $45 Billion Bill in Q1

Posted on Oct 29, 2026 by Grayson Cavern

Microsoft’s 48% Azure Growth Comes With a $45 Billion Bill in Q1

A quarter ago, Microsoft Corp. (NASDAQ: MSFT) had a clear job to do. It needed to show that businesses were moving beyond experimenting with AI and making it part of their everyday operations.

Its quarter one FY2027 offers a strong answer, with Azure revenue accelerating to 48% growth and Microsoft Cloud revenue reaching $63.9 billion. Yet as Satya Nadella’s company builds out the infrastructure to meet that demand, the cost of keeping customers supplied is rising alongside the revenue.

Azure Is Starting to Show What AI Demand Looks Like


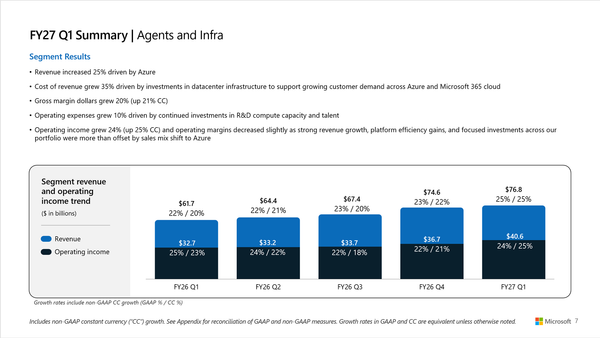
Microsoft’s first quarter of fiscal 2027 delivered $92.3 billion in revenue, up 19% year over year, while diluted earnings per share climbed 32% to $4.92. Operating income rose 21% to $45.9 billion, and net income reached $36.6 billion, up 32%.

Those headline figures look strong, although the details tell us more about where the growth is coming from. The Agents and Infrastructure segment generated $76.8 billion in revenue, up 25%, with Azure leading the charge at 48% growth. Microsoft Cloud revenue increased 30% to $63.9 billion, supported by demand across Azure and Microsoft 365 commercial cloud.
microsoft - StockEarnings

I’m paying attention to how those businesses reinforce one another. Microsoft 365 commercial cloud revenue grew 17% on a reported basis, with higher revenue per user reflecting continued upgrades to premium offerings such as Microsoft 365 Copilot, E5 and E7. The company also reported increased consumption of usage-based services, primarily GitHub Copilot.

That is the kind of activity I wanted to see earlier. Customers can buy an AI product once and leave it sitting on the shelf, or they can use it across their daily work and generate ongoing demand for Microsoft’s software and cloud infrastructure. Higher revenue per user and increased usage suggest the second outcome is gaining ground.

Commercial remaining performance obligations provide another sign of demand. The company reported $677 billion in commercial RPO, up 73% year over year. Around 30% is expected to be recognized as revenue over the next 12 months, representing a 29% increase. The remaining portion, scheduled beyond the next 12 months, grew 98%.

That gives Microsoft a substantial pool of contracted business to work through, although commitments still have to become recognized revenue and cash. The next part of the results shows what it costs to deliver on them.

Business Growth And The Cost of Serving

Microsoft’s capital expenditures, including assets acquired under finance leases, rose 30% to $45.2 billion. Roughly three quarters went toward short-lived assets, primarily CPUs and GPUs, supporting Azure, Microsoft 365 cloud, research and development, and replacement of aging server and networking equipment.

Cash paid for property and equipment reached $39.4 billion, up 103%. Meanwhile, operating cash flow increased 29% to $58 billion, helped by strong cloud billings and collections.

That combination tells me Microsoft is generating substantial cash from its business while committing more of it to the infrastructure needed to keep growth going. Free cash flow, however, fell 27% to $18.6 billion as capital spending climbed.

I wouldn’t treat one quarter of lower free cash flow as proof that the AI investment is failing. The company is building capacity to meet demand that is already showing up in Azure revenue and customer commitments. Still, investors need to see that this spending produces enough recurring revenue and operating profit to justify the scale of the investment.

Microsoft Cloud’s gross margin percentage fell to 66% from 68% a year earlier, with management attributing the decline to a shift in sales mix toward Azure, partly offset by product-level margin improvements, primarily in Azure. That gives investors another figure to watch as cloud growth accelerates.

This changes how I view MSFT a little. Revenue growth is encouraging, and the contracted demand is substantial. The next test is whether the tech giant can keep expanding its cloud business without allowing the cost of serving that demand to consume too much of the financial benefit.

Nadella Has More Demand to Serve

The results were not equally strong across Microsoft’s businesses. Its Devices and Consumer segment generated $15.5 billion in revenue, down 3%. Windows OEM and devices revenue fell 22%, reflecting the prior-year benefit from Windows 10 end-of-support demand, channel inventory drawdowns, and weaker PC market demand. Search and advertising revenue excluding traffic acquisition costs grew 12%, providing some support, while Xbox content and services revenue declined 2%.

For Nadella, the challenge is to keep the fast-growing AI and cloud businesses expanding while the more mature parts of Microsoft’s portfolio face slower demand. 

The next quarter’s guidance now gives investors a new benchmark. Microsoft expects revenue of $96 billion to $97.1 billion in fiscal Q2 2027, implying 18% to 19% growth, with Azure growth forecast at 49% to 50%. That outlook points to further acceleration in Azure, so the next report will need to show whether demand and profitability can keep pace with the spending.

The Chart Responded

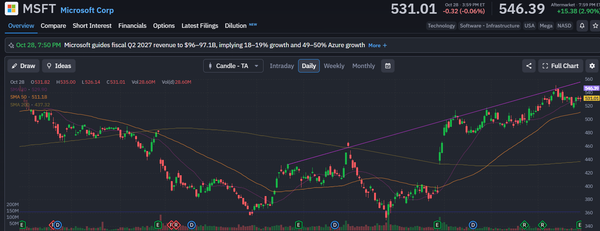
The market’s first response was encouraging. MSFT closed at $531.01 and traded at $546.39 after hours, up 2.9%. The close sat above the 20-day moving average near $529.90 and the 50-day average near $511.18, while the 200-day average remained much lower at $437.32. The move is a positive response to stronger cloud growth and guidance, though the next session will show whether buyers are willing to hold those gains. I’m watching whether the stock can stay above its recent trading range while Azure approaches the growth rate management has forecast.
microsoft - StockEarnings

All told, Microsoft has given investors more evidence that enterprise AI demand is translating into revenue. My view now depends on the next step: whether that growth can produce stronger cash generation as the infrastructure bill keeps rising. Azure is delivering the demand. MSFT still has to show how much lasting financial value it can extract from it.


Join over 1.2M+ investors/traders who receive daily and weekly notable earnings alerts with predicted move