Freeport-McMoRan Inc. (NYSE: FCX) reported third-quarter 2026 earnings on October 27, and the core numbers were strong. Adjusted earnings per share rose to 88 cents from 50 cents a year ago. Adjusted EBITDA climbed to $3.2 billion. Operating cash flow reached $2.0 billion.
Yet Freeport-McMoRan stock has spent two months sliding from its late-August high near $80. Shares closed at $65.95 on earnings day, just above their 200-day moving average. Trimmed guidance and rising costs gave sellers a reason to stay cautious.
That disconnect highlights something unusual about FCX. It is both a trade and an investment at the same time. Traders appear to treat the stock as a proxy for the copper price. Long-term investors own it for the multi-year demand story behind electrification.
Those two camps don’t have to be at odds. In fact, the traders may be handing patient investors their entry points.
Here’s what the quarter showed, why copper’s chart matters so much to FCX’s chart, and why gold adds a second leg to the story.
Higher Copper Prices Delivered Bigger Profits on Lower Volume
Revenue rose to $7.5 billion from $7.0 billion. That gain came despite a 23% drop in copper sales volume, to 749 million pounds. The Grasberg recovery in Indonesia still weighs on volume. Price did the heavy lifting. Freeport’s average realized copper price jumped 40% to $6.54 per pound.
Grasberg is moving in the right direction. The block cave mine averaged 70,000 tons per day, up from 53,000 in Q2. The PTFI smelter also restarted. Management targets roughly 80% capacity by mid-2027 and near-full capacity by year-end 2027.
The softer spots explain the stock’s caution. Freeport trimmed 2026 copper sales guidance by about 2%, to 3.0 billion pounds. It cut 2027 guidance by roughly 2.5%, to 3.7 billion pounds. Extreme weather slowed U.S. operations, and slope issues at El Abra in Chile limited access to higher-grade ore.
Costs are rising, too. Energy costs are running about $500 million above 2025 levels. Capital-cost inflation pushed 2027 capital spending to roughly $5.2 billion, up from $4.4 billion this year. Unit net cash costs rose to $2.07 per pound from $1.40.
Copper’s Chart Gives Traders a Roadmap for FCX Stock
The quarter shows why traders watch copper so closely. Volume fell, yet earnings rose, because price carried the result. Freeport estimates that every 10-cent move in copper shifts annual EBITDA by about $390 million.
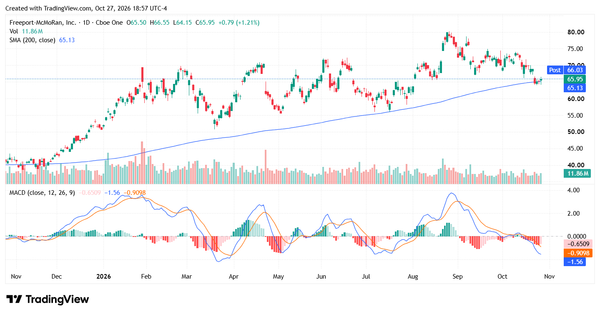
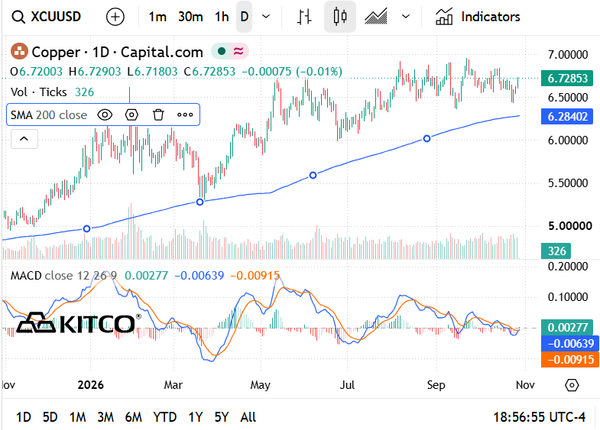
The two charts aren’t identical, but they rhyme. Both rallied through the first half of 2026. Both peaked in late summer, with FCX near $80 and copper near $6.95 per pound. Both pulled back into October.
The gap is in the size of the pullback. Copper sits only about 3% below its high and well above its 200-day average. FCX is roughly 18% off its peak and testing its 200-day line.
Momentum tells a similar story. Copper’s MACD has turned up near the zero line. FCX’s is still falling. Copper has also outperformed FCX for the year. If the stock catches up to the metal, that gap is where traders find their opportunity.
Long-Term Copper Demand Turns Pullbacks Into Buying Opportunities
Investors shouldn’t put too much weight on a 2% guidance trim. The investment case rests on years of demand, not one quarter of weather. More than 65% of the world’s copper goes into applications that deliver electricity. Freeport cites forecasts for roughly 50% growth in global electricity demand through 2040. Data centers, grid upgrades and defense are all copper-intensive.
Freeport has a growth runway to match. Even after the cut, it projects copper sales growth of 23% in 2027 and 11% in 2028. A Bagdad expansion decision is expected this quarter. Management sees a path to 4.5 to 5 billion pounds by 2030.
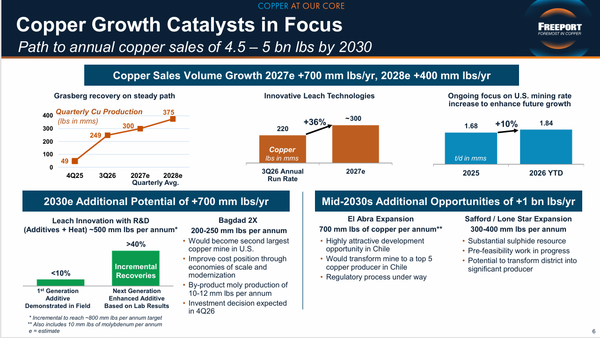
With net debt of just $1.8 billion, excluding Indonesian downstream projects, Freeport can fund that pipeline. Investors can scale in gradually, using trader-driven selloffs to add shares.
Gold Gives Investors a Second Engine for Cash Flow
Gold doesn’t move in step with FCX the way copper does. But it carries its own long-term story. Freeport’s realized gold price rose to $4,273 per ounce, up from $3,539 a year earlier.
Volume is the swing factor. Q3 gold sales fell to just 105,000 ounces, partly due to shipment timing. Freeport expects about 300,000 ounces in Q4. It projects 1.0 million ounces in 2027 and 1.2 million in 2028 as Grasberg recovers.
The leverage is meaningful. Each $100 move in gold shifts annual EBITDA by roughly $105 million. One caveat: Freeport owns 48.76% of PT Freeport Indonesia, so minority partners share in that upside. Still, gold gives investors a second catalyst that doesn’t depend on copper traders’ mood.
Two Ways to Own FCX, One Story Underneath
Freeport-McMoRan’s third quarter showed a company earning more on less volume. Guidance trims and cost inflation are real, but they don’t change the long-term demand picture.
Traders will likely keep reading FCX through copper’s chart. That creates volatility, and volatility creates entry points. For long-term investors, the smarter move may be patience. Build a position over time, add on trader-driven dips, and let copper demand and a recovering Grasberg do the work.