ajax loader

Loading...


Ride-the-Wave Strategy – Best for Stock Traders

Ride-the-Wave targets multi-day price momentum following a company’s earnings announcement (EA). With this strategy:

  1. Buy a stock one day post-EA if a stock reacts positively post-earnings:
    1. Near the close of trading the EA-day for a pre-market-EA
    2. Near the close of the following day for a post-market-EA
  2. Sell-to-close after 7-10 days, or possibly earlier if a desired price target is reached

Similarly,

  1. short a stock one day post-EA if a stock reacts negatively post-earnings:
    1. near the close of trading the EA-day for a premarket-EA
    2. near the close of the following day for a post-market-EA
  2. then buy-to-close after 7-10 days, or possibly earlier if a desired price target is reached

Important: Ride-the-Wave is predicated on significant price momentum triggered by an EA. The 7-10 day scenario is the maximum trade hold-time. If you see post EA-momentum is halted or reversed by a significant opposite move, re-evaluate your presence in the trade.

This popular StockEarnings screen below will give you a list of stocks that historically exhibit significant price momentum following an EA for the next seven days:

  1. Stocks exhibiting positive post-EA price moves are buy-candidates
  2. Stocks exhibiting negative post-EA price moves are sell/short-candidates

The screen includes those stocks whose Earnings just came out in last two days.

Screen criteria:

  1. Earnings Date Start Date : Current Date + -1 Day
  2. Earnings Date End Date : Current Date + -2 Days
  3. Predicted Move (Next Day) Max : 7%
  4. Predicted Move (On 7th Day) Min : 7%

Strategy Guideline:

  1. Buy the stock if stock has reacted positively. Short the stock if stock has reacted negatively (see above).
  2. Close the position in 7-10 days, or possibly earlier based on price move.

Volatility Crush Strategy - Best for Options Traders

The Volatility Crush strategy is used with stocks that typically experience relatively low-to-moderate price moves (≤4%) following their Earnings Announcements (EA). The basic trade idea is to sell put or call options right before the EA, collecting a credit when options premium is very high due to elevated implied volatility (IV). You then close the position right after the EA by buying the option back much cheaper due to the significant drop in IV that occurs after the mystery of the EA disappears. In assessing this trade, you need to do your homework to ensure you collect sufficient premium to make the trade worthwhile.

This trade is practical due to the low-to-moderate price-move after the EA, which generally won’t significantly affect the options price, unlike an “action” stock, which experience great price moves post-EA. With these symbols, if you’re on the right side of the price move, that’s a great thing. But if you’re on the wrong side of the move, not so great. Consequently, by minimizing the effect of the post-EA price move, you have a much better chance to profit from the reduction in IV without it being ruined by a violent price move.

For this trade, open the position either (1) the night before the EA when the company announces earnings or (2) during the EA day when it announces post-market, generally capturing IV at or close to its peak.

For this trade, open the position either (1) the night before the EA when the company announces earnings or (2) during the EA day when it announces post-market, generally capturing IV at or close to its peak.

This popular stockearnings screen will give you a list of stocks which do not react more than 4% fpost-EA. It includes only those stocks whose earnings are releasing next day.

Screen criteria:

  1. Earnings Date Start Date : Current Date + 1
  2. Earnings Date End Date : Current Date + 1
  3. Predicted Move (Next Day) Max : 4%
  4. Options Type: Weekly

Strategy Guideline:

  1. Options Strategy: Sell Call and Put
  2. Options Strike Price: Current Stock Price – (% Predicated Move x 2)
  3. Expiration Date: It should generally be the closest expiry immediately after the EA.
  4. Buy Insurance: Buying back Call and Put at Strike price which 10% lower than Sell Strike Price is optional but recommended.

Watch Video for More Detail

Volatility Rush Strategy - Best for Options Traders

The Volatility Rush takes advantage of increasing options premiums into earnings announcements (EA) caused by an anticipated rise in Implied Volatility (IV). With this strategy, Buy a Call and Put at-the-money (a long straddle) 2-3 weeks before the EA when IV is lower. Sell the position either (1) the night before the EA when the company announces earnings pre-market, or (2) during the EA day when it announces post-market, generally capturing IV at or close to its peak.

This popular screen will give you a list of stocks whose Options premiums tend to rise into Earnings. It includes only those stocks whose Earnings are at least two weeks away from today.

Screen criteria:

  1. Earnings Date Start Date : Current Date + 15 Days
  2. Earnings Date End Date : Current Date + 30 Days
  3. Predicted Move (Next Day) Min : 5%
  4. Options Type: Weekly or Monthly if that lines up with the two to three-week lead-time for entering the trade

Strategy Guideline:

  1. Buy a Straddle at or close to the money two to three weeks pre-EA.
  2. Sell the position either the night before the EA when the company announces earnings pre-market, or during the EA day when it announces post-market.
  3. Expiration date should generally be the closest expiry immediately after the EA.
  4. Straddle price should not be more 60% of predicted move.

Predicted Move (Volatility)

Similar to Implied Volatility in Options. Expected volatility % based on our Proprietary Volatility Predication Model. We are expecting that stock price will likely to reach % in either direction by the end of next trading session after Earnings are released and not necessarily the closing volatility %.

Why is it important?

    This indicator helps

  1. Knowing expected volatility in stocks after Earnings helps to decide trading stocks before Earnings Announcement.
  2. Taking Advantage of volatility collapse following Earnings Results by using Advance Options strategies such as Spread and Straddles.

Since Last Earnings

Change in share price since last Earnings release.

Why is it Important?

When share has gained more than 10% since it's last Earning release, it tends to over react to minor bad news and give up some gains if not all. So, it contains more downside volatility than upside When share has dropped more than 10% since it's last Earning release, it tends to over react to minor good news and recover some drops if not all. So, it contains more upside volatility than downside.

EPS Surprise (%)

Occurs when a company's reported quarterly or annual profits are above or below analysts' expectations. Here is the formula to derive % EPS Surprice:

Actual EPS - Estimated EPS
------------------------------------- x 100
Estimated EPS

Why is it Important?

Earnings surprises can have a huge impact on a company's stock price. Several studies suggest that positive earnings surprises not only lead to an immediate hike in a stock's price, but also to a gradual increase over time. Hence, it's not surprising that some companies are known for routinely beating earning projections. A negative earnings surprise will usually result in a decline in share price.

Next Day Price Change (%)

Next Regular trading session Closing price following Earnings result.

For After Market Close Earnings, It is a next trading day closing price. For Before Market Open Earnings, It is the same trading day closing price.

Why is it Important?

Next Day price change is a reaction of Earnings result.

Micron’s $25 Billion Cash Machine Faces a Big Q4 Test

Posted on Sep 28, 2026 by Grayson Cavern

Micron’s $25 Billion Cash Machine Faces a Big Q4 Test

Micron Technology (NASDAQ: MU) heads into Wednesday’s earnings with numbers that would have seemed absurd a year ago. The company generated $25.4 billion of operating cash flow in Q3, while gross margin hit 84.9%, and management is guiding for another $50 billion of revenue and roughly 86% gross margin in Q4. Wall Street already expects about $50.86 billion of revenue and $31.45 in adjusted EPS, putting the bar close to management’s own guide before the report even lands.

The bigger story, though, is that Micron has spent 2026 turning a memory shortage into an enormous cash-generating machine, and now billions of those dollars are heading straight back into fabs, HBM, packaging, and new memory capacity.

What Happened In Q3?


Micron’s Q3 revenue explosion came overwhelmingly from what it could charge for each bit. DRAM revenue jumped 67% sequentially to $31.3 billion while bit shipments grew only in the low-single digits and average selling prices rose in the low-60% range. NAND revenue nearly doubled sequentially to $9.9 billion as ASPs climbed in the mid-80% range while bit shipments increased only in the mid-single digits.

That pricing translated into extraordinary operating leverage. Micron produced $33.7 billion of operating income and $28.9 billion of net income from $41.5 billion of revenue in Q3, while operating cash flow reached $25.4 billion.

Management expects DRAM and NAND demand to remain significantly above supply beyond 2027, while new fabs take years to build and the industry faces constraints around construction, labor, energy and manufacturing complexity.

That creates the setup for the next phase of the cycle. Micron can use today’s extraordinary cash generation to expand capacity while demand for AI servers, HBM and high-capacity memory keeps pulling supply forward.

$100 Billion Of Commitments Meets A Massive Capex Program

Micron now has 16 strategic customer agreements typically running from 2026 through 2030, covering roughly 20% of its DRAM volume and one-third of NAND volume. Fourteen of those agreements carry minimum-price revenue commitments totaling approximately $100 billion, while Micron says the agreements could eventually cover half or more of company revenue.

Several years of committed demand are now sitting against a much larger investment program. Micron expects roughly $10 billion of capex in Q4 and around $27 billion for fiscal 2026, with quarterly FY2027 capex expected to run above the Q4 level.

That is where the classic memory-cycle risk comes back into the picture. Micron, Samsung Electronics (KRX: 005930) and SK hynix (NASDAQ: SKHY) are all responding to the same shortage, so eventually the industry will add enough capacity to pressure pricing if supply grows faster than demand.

Micron’s contracts provide some insulation from that outcome because customers are committing to supply ahead of the new capacity coming online. The company is also negotiating pricing structures that include floors and ceilings, while planned agreements with fixed or near-current price ceilings are expected to represent roughly 40% of revenue.

The question for the next couple of years is therefore less about whether Micron can sell the additional memory and more about what margins look like once the new supply starts arriving.

HBM And Server Memory Raise The Ceiling

Micron is also pushing its mix toward products where capacity and performance are becoming strategic requirements for AI infrastructure.

The company is ramping 1-gamma DRAM and G9 NAND, preparing next-generation nodes for volume production in the second half of 2027 and ramping 12-high HBM4 at twice the speed of its HBM3E ramp. More than $1 billion of HBM4 revenue has already shipped.

On September 15, Micron unveiled a 512GB DDR5 RDIMM capable of speeds up to 9,200 MT/s, with operating power up to 60% lower than four 128GB modules. Advanced Micro Devices (NASDAQ: AMD) and Intel (NASDAQ: INTC) are validating the module for next-generation servers, with volume production expected in the second half of 2027.

The economics here are different from simply selling more commodity DRAM. AI servers need more memory, faster memory and increasingly dense memory configurations, giving Micron more ways to grow revenue through product mix while the industry works through the broader supply shortage.

A Clean Line In The Sand

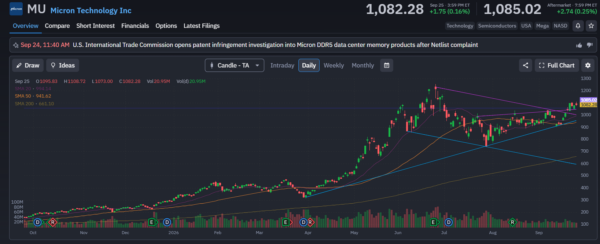
Micron closed September 25 at $1,082.28, with the 20-day moving average around $994, the 50-day around $942, and the 200-day around $661. The stock has reclaimed the $1,000 area and remains above all three averages, but the previous high around $1,220 is still overhead, and the descending trendline from that peak has not been decisively cleared.

For the earnings trade, $1,000 is the first level I’d keep on the screen because it sits close to the 20-day average. Around $942, the 50-day becomes the next major reference point. A strong report followed by a hold above those levels would keep the recent breakout structure intact, while a sharp rejection from the 1,100–1,220 area followed by a break back through the moving averages would put the recent run under much more pressure.

Wall Street is already looking for roughly $50.86 billion of revenue and $31.45 of adjusted EPS, so a modest beat alone may not be enough to reset the stock’s trajectory. The bigger reaction should come from what management says about DRAM pricing, HBM supply, FY2027 margins, and the return on the enormous capex program now being built.

Since MU has already shown what a severe memory shortage can do to its income statement. The next leg of the story would be whether those economics can survive the billions being spent to expand the supply behind them.
micron - StockEarnings

Join over 1.2M+ investors/traders who receive daily and weekly notable earnings alerts with predicted move
