ajax loader

Loading...


Ride-the-Wave Strategy – Best for Stock Traders

Ride-the-Wave targets multi-day price momentum following a company’s earnings announcement (EA). With this strategy:

  1. Buy a stock one day post-EA if a stock reacts positively post-earnings:
    1. Near the close of trading the EA-day for a pre-market-EA
    2. Near the close of the following day for a post-market-EA
  2. Sell-to-close after 7-10 days, or possibly earlier if a desired price target is reached

Similarly,

  1. short a stock one day post-EA if a stock reacts negatively post-earnings:
    1. near the close of trading the EA-day for a premarket-EA
    2. near the close of the following day for a post-market-EA
  2. then buy-to-close after 7-10 days, or possibly earlier if a desired price target is reached

Important: Ride-the-Wave is predicated on significant price momentum triggered by an EA. The 7-10 day scenario is the maximum trade hold-time. If you see post EA-momentum is halted or reversed by a significant opposite move, re-evaluate your presence in the trade.

This popular StockEarnings screen below will give you a list of stocks that historically exhibit significant price momentum following an EA for the next seven days:

  1. Stocks exhibiting positive post-EA price moves are buy-candidates
  2. Stocks exhibiting negative post-EA price moves are sell/short-candidates

The screen includes those stocks whose Earnings just came out in last two days.

Screen criteria:

  1. Earnings Date Start Date : Current Date + -1 Day
  2. Earnings Date End Date : Current Date + -2 Days
  3. Predicted Move (Next Day) Max : 7%
  4. Predicted Move (On 7th Day) Min : 7%

Strategy Guideline:

  1. Buy the stock if stock has reacted positively. Short the stock if stock has reacted negatively (see above).
  2. Close the position in 7-10 days, or possibly earlier based on price move.

Volatility Crush Strategy - Best for Options Traders

The Volatility Crush strategy is used with stocks that typically experience relatively low-to-moderate price moves (≤4%) following their Earnings Announcements (EA). The basic trade idea is to sell put or call options right before the EA, collecting a credit when options premium is very high due to elevated implied volatility (IV). You then close the position right after the EA by buying the option back much cheaper due to the significant drop in IV that occurs after the mystery of the EA disappears. In assessing this trade, you need to do your homework to ensure you collect sufficient premium to make the trade worthwhile.

This trade is practical due to the low-to-moderate price-move after the EA, which generally won’t significantly affect the options price, unlike an “action” stock, which experience great price moves post-EA. With these symbols, if you’re on the right side of the price move, that’s a great thing. But if you’re on the wrong side of the move, not so great. Consequently, by minimizing the effect of the post-EA price move, you have a much better chance to profit from the reduction in IV without it being ruined by a violent price move.

For this trade, open the position either (1) the night before the EA when the company announces earnings or (2) during the EA day when it announces post-market, generally capturing IV at or close to its peak.

For this trade, open the position either (1) the night before the EA when the company announces earnings or (2) during the EA day when it announces post-market, generally capturing IV at or close to its peak.

This popular stockearnings screen will give you a list of stocks which do not react more than 4% fpost-EA. It includes only those stocks whose earnings are releasing next day.

Screen criteria:

  1. Earnings Date Start Date : Current Date + 1
  2. Earnings Date End Date : Current Date + 1
  3. Predicted Move (Next Day) Max : 4%
  4. Options Type: Weekly

Strategy Guideline:

  1. Options Strategy: Sell Call and Put
  2. Options Strike Price: Current Stock Price – (% Predicated Move x 2)
  3. Expiration Date: It should generally be the closest expiry immediately after the EA.
  4. Buy Insurance: Buying back Call and Put at Strike price which 10% lower than Sell Strike Price is optional but recommended.

Watch Video for More Detail

Volatility Rush Strategy - Best for Options Traders

The Volatility Rush takes advantage of increasing options premiums into earnings announcements (EA) caused by an anticipated rise in Implied Volatility (IV). With this strategy, Buy a Call and Put at-the-money (a long straddle) 2-3 weeks before the EA when IV is lower. Sell the position either (1) the night before the EA when the company announces earnings pre-market, or (2) during the EA day when it announces post-market, generally capturing IV at or close to its peak.

This popular screen will give you a list of stocks whose Options premiums tend to rise into Earnings. It includes only those stocks whose Earnings are at least two weeks away from today.

Screen criteria:

  1. Earnings Date Start Date : Current Date + 15 Days
  2. Earnings Date End Date : Current Date + 30 Days
  3. Predicted Move (Next Day) Min : 5%
  4. Options Type: Weekly or Monthly if that lines up with the two to three-week lead-time for entering the trade

Strategy Guideline:

  1. Buy a Straddle at or close to the money two to three weeks pre-EA.
  2. Sell the position either the night before the EA when the company announces earnings pre-market, or during the EA day when it announces post-market.
  3. Expiration date should generally be the closest expiry immediately after the EA.
  4. Straddle price should not be more 60% of predicted move.

Predicted Move (Volatility)

Similar to Implied Volatility in Options. Expected volatility % based on our Proprietary Volatility Predication Model. We are expecting that stock price will likely to reach % in either direction by the end of next trading session after Earnings are released and not necessarily the closing volatility %.

Why is it important?

    This indicator helps

  1. Knowing expected volatility in stocks after Earnings helps to decide trading stocks before Earnings Announcement.
  2. Taking Advantage of volatility collapse following Earnings Results by using Advance Options strategies such as Spread and Straddles.

Since Last Earnings

Change in share price since last Earnings release.

Why is it Important?

When share has gained more than 10% since it's last Earning release, it tends to over react to minor bad news and give up some gains if not all. So, it contains more downside volatility than upside When share has dropped more than 10% since it's last Earning release, it tends to over react to minor good news and recover some drops if not all. So, it contains more upside volatility than downside.

EPS Surprise (%)

Occurs when a company's reported quarterly or annual profits are above or below analysts' expectations. Here is the formula to derive % EPS Surprice:

Actual EPS - Estimated EPS
------------------------------------- x 100
Estimated EPS

Why is it Important?

Earnings surprises can have a huge impact on a company's stock price. Several studies suggest that positive earnings surprises not only lead to an immediate hike in a stock's price, but also to a gradual increase over time. Hence, it's not surprising that some companies are known for routinely beating earning projections. A negative earnings surprise will usually result in a decline in share price.

Next Day Price Change (%)

Next Regular trading session Closing price following Earnings result.

For After Market Close Earnings, It is a next trading day closing price. For Before Market Open Earnings, It is the same trading day closing price.

Why is it Important?

Next Day price change is a reaction of Earnings result.

Should Traders Gamble on Nike (NKE) Stock? Here are the Pros and Cons.

Posted on Sep 29, 2026 by Joshua Enomoto

Should Traders Gamble on Nike (NKE) Stock? Here are the Pros and Cons.

Sports apparel giant Nike (NYSE: NKE) will soon disclose its results for the first quarter of fiscal year (FY2027), and to say that the smart money is anxious would be an understatement. Right now, implied volatility (IV) for the options chain expiring this Friday (Oct. 2) has shot up to over 80%, at least as of last Friday’s close. Historically, the IV for this period sits at under 28%, meaning that NKE stock has some juice.

The question is, where will this ticker ultimately head? Nobody knows, and that’s what’s causing chaos in the options market.

We’re going to go to OptionCharts.io, which is a free resource that every serious derivatives market trader should monitor carefully before placing a trade. Specifically, the Volatility Skew screener shows heightened hedging activity in the tails. Basically, option underwriters are demanding higher premiums to assume the consequences of extreme volatility on either end of the spectrum.

nke - StockEarnings

Translation? With the smart money lacking confidence in how the market will respond to Nike stock following the underlying company’s financial disclosure, insurance demand has spiked to protect against outcome extremes: either a big swing higher for NKE or a continued collapse of the equity.

Fundamentally, the market continues to price in the negative impact of multi-year sales erosion, severe macroeconomic pressures in China and a booting from the S&P 100 index. For those who thought that these factors have already been priced into NKE stock (such as yours truly), they have only been met with disappointment.

Yes, Nike is a powerful brand; no one should be under any illusions about that. But under this current, eroding sentiment regime, the usual quantitative response to extended bearishness — which typically is a temporary bounce higher — has not materialized.

So, the deadly follow-up question comes up: is it different this time? Here’s an unvarnished look at how options traders should view Nike stock.

Why the $37 Target is Enticing for NKE Stock Speculators


When it comes to playing the odds for Nike stock, the numbers (in my opinion) are quite clear. Usually, the technical response to NKE suffering a long bearish cycle is a dead-cat bounce, followed by a cooling off and a sideways consolidation.

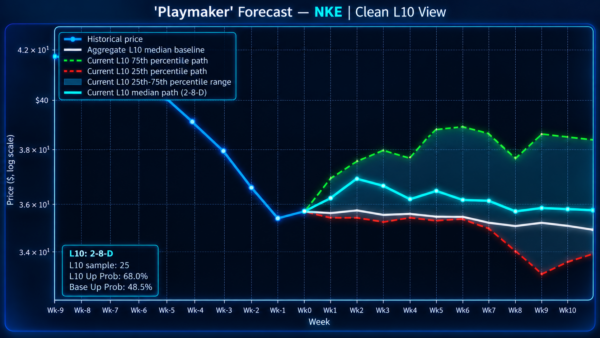
We know as an empirical fact that in the last 10 weeks, NKE stock has printed only two net positive weekly candlesticks. Mathematically, that means the eligible volume within the defined period suffered an 80% net drawdown. Almost certainly, this negative trend will change the perception of NKE. Further, this changed perception will likely alter the probabilistic trajectory of the ticker relative to the expected baseline.
nke - StockEarnings

Indeed, that is what the data bears out. Since January 2019, we know that this 2-8-D sequence (two up weeks, eight down weeks, downward slope) has materialized 25 times on a rolling basis. We also know that as a median response, NKE stock tends to rise about 4% over the next two weeks relative to the starting point.

When this trend is juxtaposed onto the time-of-writing price of $35.75, we’re looking at Nike stock clearing the $37 price level on Oct. 9 (two weeks away). However, because the fiscal Q1 earnings report is scheduled for this Thursday, IV is extraordinarily heighted for the Oct. 2 chain for obvious reasons.

So, under an inductive response, we would probably be interested in the 36/37 bull call spread expiring Oct. 2. Mechanically, by paying a net debit of $43, the speculator will be hoping that NKE stock will rise and trigger the $37 second-leg strike on expiration. If it does, the transaction will cash out a maximum profit of $57, translating to a payout of roughly 133%.

Frankly, this is the kind of positive asymmetry that you want. Based on the inductive framework above — which utilizes the Markov chain logic of the current behavioral state influencing the transition to a future behavioral state — the $37 target, when accounting for the high-IV-earnings event, is both rational and arguably credible.

Sadly, there’s a huge problem when attempting to use Markov chains for trading NKE stock.

Shifting (and Eroding) Regimes Pose Nightmares for Nike Stock

Although the data-based analysis may seem convincing for options traders, the harsh reality is that NKE stock is suffering from shifting sentiment regimes. And such regime shifts are anathema to Markov-based models, for the primary reason that the philosophical ground by which the axiom is built upon is shaky.

If we have our dataset going back to January 2019, this period captured plenty of contrarian sentiment — a period where the Nike brand was exceptionally powerful. As such, Nike stock consistently rebounded following temporary periods of discounted valuations.
nke - StockEarnings

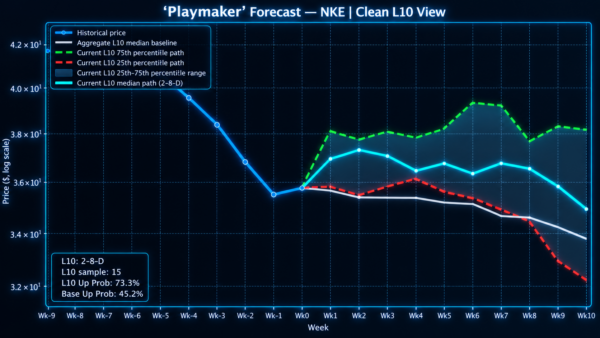
However, if we set our initial data stream to January 2022, there is a subtle shift in the expected trajectory of NKE stock following the 2-8-D sequence. Specifically, at the tail end of the forward 10-week spectrum, NKE tends to dive lower.

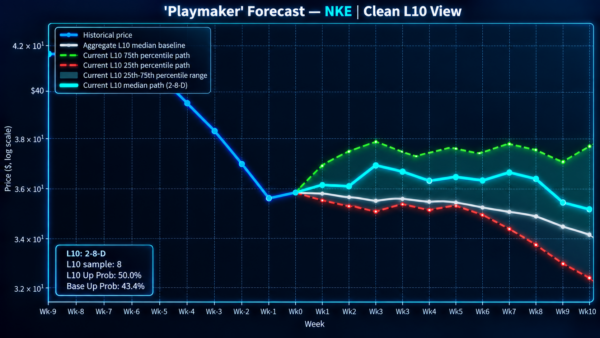
Indeed, the change becomes even more exaggerated when we start from only January 2024. Under the most recent sentiment regime, Nike stock doesn’t even pop higher until the third week of the signal flashing. And the overall performance (including the upper median band) features muted upside. Not only that, there’s a sharp risk of a severe fallout from week 8 onwards.
nke - StockEarnings

Despite the eroding sentiment regime, the overall trend is clear: following extensive bearishness, NKE stock tends to pop higher in the early weeks (whether that happens in the first week or the third). But in my opinion, it’s clear as day that Nike isn’t trustworthy as a long-term investment at this juncture.

How Should Traders Tackle Nike?

There’s really no way to sugarcoat this: NKE stock is a gamble. I know that in the blogosphere, several content creators are chirping that Nike likely can’t keep losing as it has indefinitely. In other words, this is an internationally recognized powerhouse that’s currently going through some turbulence.

That might be so, but I’m still going to look at the data. And based on the hard evidence, Nike stock appears to have a higher probability of a near-term swing higher. Ordinarily, I would say that you should be patient and consider further-out expiration dates. But because the pivotal earnings report is just around the corner, you may get the greatest mileage out of this Friday’s options chain.

Of course, you’re going to have to accept the risk that this is essentially a binary trade. If the market does not respond bullishly, there’s just zero time for the thesis to pan out. Therefore, the bull spread I mentioned above will expire worthless. Still, the silver lining is that because expiration is so soon, you won’t have to pay much time value for the spread.

As for the long-term investment case, I don’t think the data currently supports that particular thesis. Nike has a lot to prove before it inspires confidence as a buy-and-hold play. So, my assessment on the matter is: if you don’t like gambling, stay away from Nike stock. If you do like to roll the dice, NKE at $37 seems contextually reasonable.


Joshua Enomoto is a seasoned financial writer with a strong track record of in-depth stock analysis, offering clear, insightful commentary for retail investors across all levels of expertise. Renowned for his ability to blend analytical rigor with engaging wit, Joshua's work has been featured on leading investment platforms, including TipRanks, InvestorPlace, Barchart, Benzinga, and Fintel. He was also handpicked to spearhead high-impact initiatives such as InvestorPlace's "Trade of the Day" and Benzinga’s ETF coverage. As a frequent guest expert for CGTN America, Joshua discusses a wide range of economic, societal, and consumer market trends. A graduate of U.C. San Diego, Joshua brings a thoughtful and fresh perspective to complex financial narratives, helping enterprise clients connect with their audiences. He also composes music in his spare time.

Join over 1.2M+ investors/traders who receive daily and weekly notable earnings alerts with predicted move