ajax loader

Loading...


Ride-the-Wave Strategy – Best for Stock Traders

Ride-the-Wave targets multi-day price momentum following a company’s earnings announcement (EA). With this strategy:

  1. Buy a stock one day post-EA if a stock reacts positively post-earnings:
    1. Near the close of trading the EA-day for a pre-market-EA
    2. Near the close of the following day for a post-market-EA
  2. Sell-to-close after 7-10 days, or possibly earlier if a desired price target is reached

Similarly,

  1. short a stock one day post-EA if a stock reacts negatively post-earnings:
    1. near the close of trading the EA-day for a premarket-EA
    2. near the close of the following day for a post-market-EA
  2. then buy-to-close after 7-10 days, or possibly earlier if a desired price target is reached

Important: Ride-the-Wave is predicated on significant price momentum triggered by an EA. The 7-10 day scenario is the maximum trade hold-time. If you see post EA-momentum is halted or reversed by a significant opposite move, re-evaluate your presence in the trade.

This popular StockEarnings screen below will give you a list of stocks that historically exhibit significant price momentum following an EA for the next seven days:

  1. Stocks exhibiting positive post-EA price moves are buy-candidates
  2. Stocks exhibiting negative post-EA price moves are sell/short-candidates

The screen includes those stocks whose Earnings just came out in last two days.

Screen criteria:

  1. Earnings Date Start Date : Current Date + -1 Day
  2. Earnings Date End Date : Current Date + -2 Days
  3. Predicted Move (Next Day) Max : 7%
  4. Predicted Move (On 7th Day) Min : 7%

Strategy Guideline:

  1. Buy the stock if stock has reacted positively. Short the stock if stock has reacted negatively (see above).
  2. Close the position in 7-10 days, or possibly earlier based on price move.

Volatility Crush Strategy - Best for Options Traders

The Volatility Crush strategy is used with stocks that typically experience relatively low-to-moderate price moves (≤4%) following their Earnings Announcements (EA). The basic trade idea is to sell put or call options right before the EA, collecting a credit when options premium is very high due to elevated implied volatility (IV). You then close the position right after the EA by buying the option back much cheaper due to the significant drop in IV that occurs after the mystery of the EA disappears. In assessing this trade, you need to do your homework to ensure you collect sufficient premium to make the trade worthwhile.

This trade is practical due to the low-to-moderate price-move after the EA, which generally won’t significantly affect the options price, unlike an “action” stock, which experience great price moves post-EA. With these symbols, if you’re on the right side of the price move, that’s a great thing. But if you’re on the wrong side of the move, not so great. Consequently, by minimizing the effect of the post-EA price move, you have a much better chance to profit from the reduction in IV without it being ruined by a violent price move.

For this trade, open the position either (1) the night before the EA when the company announces earnings or (2) during the EA day when it announces post-market, generally capturing IV at or close to its peak.

For this trade, open the position either (1) the night before the EA when the company announces earnings or (2) during the EA day when it announces post-market, generally capturing IV at or close to its peak.

This popular stockearnings screen will give you a list of stocks which do not react more than 4% fpost-EA. It includes only those stocks whose earnings are releasing next day.

Screen criteria:

  1. Earnings Date Start Date : Current Date + 1
  2. Earnings Date End Date : Current Date + 1
  3. Predicted Move (Next Day) Max : 4%
  4. Options Type: Weekly

Strategy Guideline:

  1. Options Strategy: Sell Call and Put
  2. Options Strike Price: Current Stock Price – (% Predicated Move x 2)
  3. Expiration Date: It should generally be the closest expiry immediately after the EA.
  4. Buy Insurance: Buying back Call and Put at Strike price which 10% lower than Sell Strike Price is optional but recommended.

Watch Video for More Detail

Volatility Rush Strategy - Best for Options Traders

The Volatility Rush takes advantage of increasing options premiums into earnings announcements (EA) caused by an anticipated rise in Implied Volatility (IV). With this strategy, Buy a Call and Put at-the-money (a long straddle) 2-3 weeks before the EA when IV is lower. Sell the position either (1) the night before the EA when the company announces earnings pre-market, or (2) during the EA day when it announces post-market, generally capturing IV at or close to its peak.

This popular screen will give you a list of stocks whose Options premiums tend to rise into Earnings. It includes only those stocks whose Earnings are at least two weeks away from today.

Screen criteria:

  1. Earnings Date Start Date : Current Date + 15 Days
  2. Earnings Date End Date : Current Date + 30 Days
  3. Predicted Move (Next Day) Min : 5%
  4. Options Type: Weekly or Monthly if that lines up with the two to three-week lead-time for entering the trade

Strategy Guideline:

  1. Buy a Straddle at or close to the money two to three weeks pre-EA.
  2. Sell the position either the night before the EA when the company announces earnings pre-market, or during the EA day when it announces post-market.
  3. Expiration date should generally be the closest expiry immediately after the EA.
  4. Straddle price should not be more 60% of predicted move.

Predicted Move (Volatility)

Similar to Implied Volatility in Options. Expected volatility % based on our Proprietary Volatility Predication Model. We are expecting that stock price will likely to reach % in either direction by the end of next trading session after Earnings are released and not necessarily the closing volatility %.

Why is it important?

    This indicator helps

  1. Knowing expected volatility in stocks after Earnings helps to decide trading stocks before Earnings Announcement.
  2. Taking Advantage of volatility collapse following Earnings Results by using Advance Options strategies such as Spread and Straddles.

Since Last Earnings

Change in share price since last Earnings release.

Why is it Important?

When share has gained more than 10% since it's last Earning release, it tends to over react to minor bad news and give up some gains if not all. So, it contains more downside volatility than upside When share has dropped more than 10% since it's last Earning release, it tends to over react to minor good news and recover some drops if not all. So, it contains more upside volatility than downside.

EPS Surprise (%)

Occurs when a company's reported quarterly or annual profits are above or below analysts' expectations. Here is the formula to derive % EPS Surprice:

Actual EPS - Estimated EPS
------------------------------------- x 100
Estimated EPS

Why is it Important?

Earnings surprises can have a huge impact on a company's stock price. Several studies suggest that positive earnings surprises not only lead to an immediate hike in a stock's price, but also to a gradual increase over time. Hence, it's not surprising that some companies are known for routinely beating earning projections. A negative earnings surprise will usually result in a decline in share price.

Next Day Price Change (%)

Next Regular trading session Closing price following Earnings result.

For After Market Close Earnings, It is a next trading day closing price. For Before Market Open Earnings, It is the same trading day closing price.

Why is it Important?

Next Day price change is a reaction of Earnings result.

Goldman Sachs Stock Faces a Critical $900 Test Ahead of Earnings

Posted on Oct 12, 2026 by Grayson Cavern

Goldman Sachs Stock Faces a Critical $900 Test Ahead of Earnings

Goldman Sachs (NYSE: GS) faces a problem that a strong earnings report alone might not fix: its stock has broken down while investors prepare to judge whether the bank can sustain the performance that drove its earlier rally. Shares closed at $896.31 on October 12, down sharply from July’s peak near $1,150, and now trade beneath their 20-day, 50-day and 200-day moving averages.

The decline arrives after a quarter that gave Goldman Sachs shareholders plenty to celebrate. Investment banking fees surged 55%, equities revenue jumped 72%, FICC revenue grew 9%, and Asset & Wealth Management revenue climbed 18%. The firm also posted a 23.5% annualized return on common equity. With those results setting a high bar, the upcoming third-quarter report needs to show whether its core franchises can keep producing the earnings power behind the bullish case.

Wall Street Needs More Than Another Strong Quarter


Goldman’s second-quarter results established a demanding comparison. Investment banking benefited from stronger deal activity, equities produced exceptional growth, and Asset & Wealth Management expanded its contribution. Those businesses give the bank several ways to generate revenue, but they also make the next report dependent on how trading conditions and client activity developed during the summer.

Investment banking deserves close attention. A 55% jump in fees is a substantial year-over-year gain, and investors will want evidence that dealmaking and underwriting activity remain healthy. Advisory fees can fluctuate with transaction timing, while equity and debt underwriting depend on issuance conditions. A softer quarter would not erase the prior improvement, but it could make the second-quarter growth rate look difficult to repeat.

Equities is another major test after its 72% revenue surge. Trading performance can benefit from client activity, volatility, and market conditions, yet the comparison with last year’s quarter will determine how much growth Goldman Sachs can sustain. FICC, which grew 9% last quarter, adds another variable: investors will need to see whether the franchise can maintain its contribution as rates and fixed-income markets move.

The point heading into earnings is straightforward: Goldman Sachs has already demonstrated that its core businesses can produce strong results. The next report needs to show that those results have enough staying power to support earnings expectations beyond one standout quarter.

Asset Management Is the Longer-Term Growth Lever

Goldman’s strategic developments since the last earnings report offer another reason to keep Asset & Wealth Management on the radar. The firm agreed to acquire NEOS Investments, a provider of options-based income ETFs, expanding a business that can reach investors through packaged investment products.

The acquisition fits the company’s effort to build on its investment expertise and extend its reach across wealth and asset management. Options-based income products offer investors strategies designed around income generation and specific investment outcomes, while giving Goldman Sachs another channel to monetize its markets capabilities. The strategic appeal is clear, although the deal should be viewed as a longer-term growth initiative rather than an assumed source of material third-quarter earnings.

Goldman Sachs has also continued investing in engineering capacity. Its new Bellevue, Washington, office is intended to accommodate more than 125 employees focused on AI and cloud transformation, while Dinesh Keswani joined the firm as a partner and co-head of Core Engineering. These moves show continued investment in technology and infrastructure, but the earnings report will need to provide evidence before we can attribute measurable revenue growth or cost savings to them.

For this quarter, the immediate focus remains the performance of the existing businesses. Asset & Wealth Management delivered 18% revenue growth in Q2; maintaining momentum there would help diversify Goldman’s earnings contribution if trading or investment banking cools.

GS Has Lost Its Technical Advantage

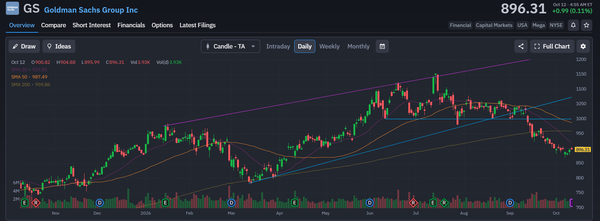
The chart has deteriorated considerably since the last earnings report. Goldman reached roughly $1,150 in July before rolling over, losing the $1,000 area and accelerating lower through September and early October. At $896.31, the stock sits below its 20-day simple moving average at $919.81, its 50-day at $987.49, and its 200-day at $959.86.

The 20-day average is the first hurdle for a recovery attempt, while the 200-day near $960 and the 50-day around $987–$988 form a much tougher resistance zone. The former $1,000 support area could also become overhead supply if the stock rebounds into it.

A strong earnings reaction could help GS reclaim $920 and put $960 back in play. A move through $1,000 would be a more substantial repair of the technical damage. If the stock fails to hold the recent $880–$900 area, however, sellers could maintain control even if the headline results look respectable.

That is why I would not treat a positive earnings surprise as an automatic buy signal. Investors will be weighing the figures against the strength of the previous quarter, and the guidance and commentary could carry as much weight as the headline revenue and earnings numbers.
goldman sachs - StockEarnings

The Bull Case Depends on Earnings Durability

I remain constructive on Goldman Sachs heading into the release because the firm’s core franchises delivered strong growth last quarter, and the NEOS agreement extends its longer-term ambitions in asset management. The bullish case rests on investment banking activity remaining healthy, equities holding up against a tough comparison, and Asset & Wealth Management sustaining its contribution.

The risk is that Q2 set expectations too high. If trading revenue retreats or investment banking fees soften, the stock’s breakdown could reflect a real reassessment of future earnings rather than a temporary technical correction. The chart offers little confirmation of a recovery at present.

My bias is BUY, but the earnings reaction needs to confirm it. A reclaim of $920 would be the first sign that buyers are returning, while $960 and then $1,000 are the levels GS needs to overcome for a stronger recovery. Until the report supplies fresh evidence, this is a bullish thesis facing a technical test – not a confirmed reversal.


Join over 1.2M+ investors/traders who receive daily and weekly notable earnings alerts with predicted move