ajax loader

Loading...


Ride-the-Wave Strategy – Best for Stock Traders

Ride-the-Wave targets multi-day price momentum following a company’s earnings announcement (EA). With this strategy:

  1. Buy a stock one day post-EA if a stock reacts positively post-earnings:
    1. Near the close of trading the EA-day for a pre-market-EA
    2. Near the close of the following day for a post-market-EA
  2. Sell-to-close after 7-10 days, or possibly earlier if a desired price target is reached

Similarly,

  1. short a stock one day post-EA if a stock reacts negatively post-earnings:
    1. near the close of trading the EA-day for a premarket-EA
    2. near the close of the following day for a post-market-EA
  2. then buy-to-close after 7-10 days, or possibly earlier if a desired price target is reached

Important: Ride-the-Wave is predicated on significant price momentum triggered by an EA. The 7-10 day scenario is the maximum trade hold-time. If you see post EA-momentum is halted or reversed by a significant opposite move, re-evaluate your presence in the trade.

This popular StockEarnings screen below will give you a list of stocks that historically exhibit significant price momentum following an EA for the next seven days:

  1. Stocks exhibiting positive post-EA price moves are buy-candidates
  2. Stocks exhibiting negative post-EA price moves are sell/short-candidates

The screen includes those stocks whose Earnings just came out in last two days.

Screen criteria:

  1. Earnings Date Start Date : Current Date + -1 Day
  2. Earnings Date End Date : Current Date + -2 Days
  3. Predicted Move (Next Day) Max : 7%
  4. Predicted Move (On 7th Day) Min : 7%

Strategy Guideline:

  1. Buy the stock if stock has reacted positively. Short the stock if stock has reacted negatively (see above).
  2. Close the position in 7-10 days, or possibly earlier based on price move.

Volatility Crush Strategy - Best for Options Traders

The Volatility Crush strategy is used with stocks that typically experience relatively low-to-moderate price moves (≤4%) following their Earnings Announcements (EA). The basic trade idea is to sell put or call options right before the EA, collecting a credit when options premium is very high due to elevated implied volatility (IV). You then close the position right after the EA by buying the option back much cheaper due to the significant drop in IV that occurs after the mystery of the EA disappears. In assessing this trade, you need to do your homework to ensure you collect sufficient premium to make the trade worthwhile.

This trade is practical due to the low-to-moderate price-move after the EA, which generally won’t significantly affect the options price, unlike an “action” stock, which experience great price moves post-EA. With these symbols, if you’re on the right side of the price move, that’s a great thing. But if you’re on the wrong side of the move, not so great. Consequently, by minimizing the effect of the post-EA price move, you have a much better chance to profit from the reduction in IV without it being ruined by a violent price move.

For this trade, open the position either (1) the night before the EA when the company announces earnings or (2) during the EA day when it announces post-market, generally capturing IV at or close to its peak.

For this trade, open the position either (1) the night before the EA when the company announces earnings or (2) during the EA day when it announces post-market, generally capturing IV at or close to its peak.

This popular stockearnings screen will give you a list of stocks which do not react more than 4% fpost-EA. It includes only those stocks whose earnings are releasing next day.

Screen criteria:

  1. Earnings Date Start Date : Current Date + 1
  2. Earnings Date End Date : Current Date + 1
  3. Predicted Move (Next Day) Max : 4%
  4. Options Type: Weekly

Strategy Guideline:

  1. Options Strategy: Sell Call and Put
  2. Options Strike Price: Current Stock Price – (% Predicated Move x 2)
  3. Expiration Date: It should generally be the closest expiry immediately after the EA.
  4. Buy Insurance: Buying back Call and Put at Strike price which 10% lower than Sell Strike Price is optional but recommended.

Watch Video for More Detail

Volatility Rush Strategy - Best for Options Traders

The Volatility Rush takes advantage of increasing options premiums into earnings announcements (EA) caused by an anticipated rise in Implied Volatility (IV). With this strategy, Buy a Call and Put at-the-money (a long straddle) 2-3 weeks before the EA when IV is lower. Sell the position either (1) the night before the EA when the company announces earnings pre-market, or (2) during the EA day when it announces post-market, generally capturing IV at or close to its peak.

This popular screen will give you a list of stocks whose Options premiums tend to rise into Earnings. It includes only those stocks whose Earnings are at least two weeks away from today.

Screen criteria:

  1. Earnings Date Start Date : Current Date + 15 Days
  2. Earnings Date End Date : Current Date + 30 Days
  3. Predicted Move (Next Day) Min : 5%
  4. Options Type: Weekly or Monthly if that lines up with the two to three-week lead-time for entering the trade

Strategy Guideline:

  1. Buy a Straddle at or close to the money two to three weeks pre-EA.
  2. Sell the position either the night before the EA when the company announces earnings pre-market, or during the EA day when it announces post-market.
  3. Expiration date should generally be the closest expiry immediately after the EA.
  4. Straddle price should not be more 60% of predicted move.

Predicted Move (Volatility)

Similar to Implied Volatility in Options. Expected volatility % based on our Proprietary Volatility Predication Model. We are expecting that stock price will likely to reach % in either direction by the end of next trading session after Earnings are released and not necessarily the closing volatility %.

Why is it important?

    This indicator helps

  1. Knowing expected volatility in stocks after Earnings helps to decide trading stocks before Earnings Announcement.
  2. Taking Advantage of volatility collapse following Earnings Results by using Advance Options strategies such as Spread and Straddles.

Since Last Earnings

Change in share price since last Earnings release.

Why is it Important?

When share has gained more than 10% since it's last Earning release, it tends to over react to minor bad news and give up some gains if not all. So, it contains more downside volatility than upside When share has dropped more than 10% since it's last Earning release, it tends to over react to minor good news and recover some drops if not all. So, it contains more upside volatility than downside.

EPS Surprise (%)

Occurs when a company's reported quarterly or annual profits are above or below analysts' expectations. Here is the formula to derive % EPS Surprice:

Actual EPS - Estimated EPS
------------------------------------- x 100
Estimated EPS

Why is it Important?

Earnings surprises can have a huge impact on a company's stock price. Several studies suggest that positive earnings surprises not only lead to an immediate hike in a stock's price, but also to a gradual increase over time. Hence, it's not surprising that some companies are known for routinely beating earning projections. A negative earnings surprise will usually result in a decline in share price.

Next Day Price Change (%)

Next Regular trading session Closing price following Earnings result.

For After Market Close Earnings, It is a next trading day closing price. For Before Market Open Earnings, It is the same trading day closing price.

Why is it Important?

Next Day price change is a reaction of Earnings result.

Goldman Sachs’ Uno Reverse: The Consumer Banking Bet That Came Full Circle

Posted on Jul 14, 2026 by Grayson Cavern

Goldman Sachs’ Uno Reverse: The Consumer Banking Bet That Came Full Circle

For years, Wall Street wanted Goldman Sachs Group Inc (NYSE: GS) to become something more predictable. A bigger consumer bank with smoother earnings and less dependence on the trading floors and advisory mandates that had always defined the firm’s identity.

Goldman listened, launched Marcus, partnered with Apple on the Apple Card, and committed significant capital to consumer finance in pursuit of the diversification that analysts and investors kept insisting the business needed to justify a higher multiple.

With second quarter earnings per common share and revenue coming in at $20.98 and $20.34 billion respectively, I’m starting to wonder whether investors were asking Goldman to solve the wrong problem entirely, because this earnings revealed that Goldman Sachs has stopped trying to be something it never actually needed to become.

What Happens When Goldman Retreats From The Consumer?


Platform Solutions revenue fell 64% year-over-year, and under normal circumstances that kind of decline in a reportable segment dominates the post-earnings conversation. Management attributed it almost entirely to the transfer of the Apple Card loan portfolio as Goldman continues unwinding the consumer banking experiment it spent years building – and the market, to its credit, barely flinched, because what happened everywhere else in the business made that 64% decline look like addition by subtraction.

Investment banking fees surged 55%, with advisory, equity underwriting, and debt underwriting all strengthening simultaneously. Equities revenue jumped 72%. FICC revenue increased 9%. Global Banking and Markets revenue climbed 53% in total. Asset and Wealth Management delivered an 18% revenue increase as management fees, incentive fees, and private banking activity all improved in the same quarter. Proving that the capital that was previously being deployed into low-return consumer lending is now flowing back toward the franchises where Goldman has always generated its highest returns, and the income statement is reflecting that reallocation in real time.

Goldman Was Never Built To Win On Checking Accounts

One assumption about Goldman Sachs has always struck me as fundamentally wrong, and this quarter makes it worth challenging directly. The conventional view is that Goldman thrives when markets go up, that the firm is essentially a leveraged bet on bull market conditions.

I don’t think that’s accurate, and these results provide the clearest evidence yet for why. Goldman thrives when clients do something: raise capital, merge with another company, issue stock, refinance debt, reposition portfolios, or trade risk across asset classes. The directionality of markets matters far less than the activity level of the clients sitting inside them, and almost every major driver behind this quarter points to a global corporate environment that is becoming more active after a period of relative paralysis.

That’s why the consumer banking exit deserves to be read as a strategic clarification rather than a retreat, because very few institutions on earth can replicate what Goldman does in capital markets, M&A advisory, and institutional trading at the scale and consistency Goldman operates at, and the consumer banking experiment was, in hindsight, an attempt to solve a perception problem rather than a business problem. The market never needed Goldman to have a checking account product. It needed Goldman to keep being the financial partner that corporations and institutions call when they’re making their most consequential capital decisions, and every number in this quarter confirms the firm is exceptionally good at exactly that.

The quality of the underlying business shows up beyond the revenue lines as well. Goldman generated a 23.5% return on average common shareholders’ equity and a 24.8% return on tangible common equity, while book value per share increased to $367.67 despite returning $5.36 billion to shareholders through buybacks and dividends in the same period… a combination that reflects a firm allocating capital toward its strongest franchises rather than spreading it across businesses where its competitive advantage was always thinner than the growth story suggested.

A Visible Confirmation Of Goldman’s Strategy

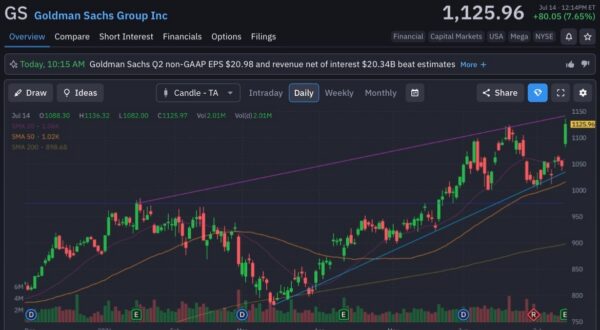
Goldman Sachs (NYSE: GS) exploded to a fresh all-time high of roughly $1,136 following earnings before settling near $1,122, a gain of more than 7% on the day. More importantly, the rally came on 1.89 million shares, well above the stock’s typical trading activity, suggesting institutional buying rather than retail speculation. Technically, the stock remains firmly above its 20-day ($1.06K), 50-day ($1.02K) and 200-day ($899) moving averages, while continuing the series of higher highs and higher lows that has defined its uptrend since April. Until those levels begin to break, the chart suggests Wall Street is treating this earnings report as confirmation of Goldman’s strategy rather than a one-quarter surprise.
goldman sachs- StockEarnings

The Lesson That Extends Well Beyond Goldman

Investors have a consistent habit of rewarding companies for entering exciting new markets, assigning premium multiples to diversification stories and punishing firms that appear too concentrated in a single area of competence… Even when that concentration is where the competitive advantage lives and where the highest returns have always been generated. 

Goldman’s earnings are a direct argument against that concept, because the quarter where it most visibly shrank one part of the business produced some of the strongest operating results the firm has ever reported across the parts that actually define what Goldman is.

So the next time you evaluate a company trading at a discount because its business looks too narrow or too dependent on a single strength, ask whether that perceived weakness is actually the competitive advantage the market is undervaluing. Because the moment Goldman stopped forcing capital into businesses where it lacked a durable edge and redirected it toward businesses where that edge was already proven, the income statement shot through the roof.


Join over 1.2M+ investors/traders who receive daily and weekly notable earnings alerts with predicted move