ajax loader

Loading...


Ride-the-Wave Strategy – Best for Stock Traders

Ride-the-Wave targets multi-day price momentum following a company’s earnings announcement (EA). With this strategy:

  1. Buy a stock one day post-EA if a stock reacts positively post-earnings:
    1. Near the close of trading the EA-day for a pre-market-EA
    2. Near the close of the following day for a post-market-EA
  2. Sell-to-close after 7-10 days, or possibly earlier if a desired price target is reached

Similarly,

  1. short a stock one day post-EA if a stock reacts negatively post-earnings:
    1. near the close of trading the EA-day for a premarket-EA
    2. near the close of the following day for a post-market-EA
  2. then buy-to-close after 7-10 days, or possibly earlier if a desired price target is reached

Important: Ride-the-Wave is predicated on significant price momentum triggered by an EA. The 7-10 day scenario is the maximum trade hold-time. If you see post EA-momentum is halted or reversed by a significant opposite move, re-evaluate your presence in the trade.

This popular StockEarnings screen below will give you a list of stocks that historically exhibit significant price momentum following an EA for the next seven days:

  1. Stocks exhibiting positive post-EA price moves are buy-candidates
  2. Stocks exhibiting negative post-EA price moves are sell/short-candidates

The screen includes those stocks whose Earnings just came out in last two days.

Screen criteria:

  1. Earnings Date Start Date : Current Date + -1 Day
  2. Earnings Date End Date : Current Date + -2 Days
  3. Predicted Move (Next Day) Max : 7%
  4. Predicted Move (On 7th Day) Min : 7%

Strategy Guideline:

  1. Buy the stock if stock has reacted positively. Short the stock if stock has reacted negatively (see above).
  2. Close the position in 7-10 days, or possibly earlier based on price move.

Volatility Crush Strategy - Best for Options Traders

The Volatility Crush strategy is used with stocks that typically experience relatively low-to-moderate price moves (≤4%) following their Earnings Announcements (EA). The basic trade idea is to sell put or call options right before the EA, collecting a credit when options premium is very high due to elevated implied volatility (IV). You then close the position right after the EA by buying the option back much cheaper due to the significant drop in IV that occurs after the mystery of the EA disappears. In assessing this trade, you need to do your homework to ensure you collect sufficient premium to make the trade worthwhile.

This trade is practical due to the low-to-moderate price-move after the EA, which generally won’t significantly affect the options price, unlike an “action” stock, which experience great price moves post-EA. With these symbols, if you’re on the right side of the price move, that’s a great thing. But if you’re on the wrong side of the move, not so great. Consequently, by minimizing the effect of the post-EA price move, you have a much better chance to profit from the reduction in IV without it being ruined by a violent price move.

For this trade, open the position either (1) the night before the EA when the company announces earnings or (2) during the EA day when it announces post-market, generally capturing IV at or close to its peak.

For this trade, open the position either (1) the night before the EA when the company announces earnings or (2) during the EA day when it announces post-market, generally capturing IV at or close to its peak.

This popular stockearnings screen will give you a list of stocks which do not react more than 4% fpost-EA. It includes only those stocks whose earnings are releasing next day.

Screen criteria:

  1. Earnings Date Start Date : Current Date + 1
  2. Earnings Date End Date : Current Date + 1
  3. Predicted Move (Next Day) Max : 4%
  4. Options Type: Weekly

Strategy Guideline:

  1. Options Strategy: Sell Call and Put
  2. Options Strike Price: Current Stock Price – (% Predicated Move x 2)
  3. Expiration Date: It should generally be the closest expiry immediately after the EA.
  4. Buy Insurance: Buying back Call and Put at Strike price which 10% lower than Sell Strike Price is optional but recommended.

Watch Video for More Detail

Volatility Rush Strategy - Best for Options Traders

The Volatility Rush takes advantage of increasing options premiums into earnings announcements (EA) caused by an anticipated rise in Implied Volatility (IV). With this strategy, Buy a Call and Put at-the-money (a long straddle) 2-3 weeks before the EA when IV is lower. Sell the position either (1) the night before the EA when the company announces earnings pre-market, or (2) during the EA day when it announces post-market, generally capturing IV at or close to its peak.

This popular screen will give you a list of stocks whose Options premiums tend to rise into Earnings. It includes only those stocks whose Earnings are at least two weeks away from today.

Screen criteria:

  1. Earnings Date Start Date : Current Date + 15 Days
  2. Earnings Date End Date : Current Date + 30 Days
  3. Predicted Move (Next Day) Min : 5%
  4. Options Type: Weekly or Monthly if that lines up with the two to three-week lead-time for entering the trade

Strategy Guideline:

  1. Buy a Straddle at or close to the money two to three weeks pre-EA.
  2. Sell the position either the night before the EA when the company announces earnings pre-market, or during the EA day when it announces post-market.
  3. Expiration date should generally be the closest expiry immediately after the EA.
  4. Straddle price should not be more 60% of predicted move.

Predicted Move (Volatility)

Similar to Implied Volatility in Options. Expected volatility % based on our Proprietary Volatility Predication Model. We are expecting that stock price will likely to reach % in either direction by the end of next trading session after Earnings are released and not necessarily the closing volatility %.

Why is it important?

    This indicator helps

  1. Knowing expected volatility in stocks after Earnings helps to decide trading stocks before Earnings Announcement.
  2. Taking Advantage of volatility collapse following Earnings Results by using Advance Options strategies such as Spread and Straddles.

Since Last Earnings

Change in share price since last Earnings release.

Why is it Important?

When share has gained more than 10% since it's last Earning release, it tends to over react to minor bad news and give up some gains if not all. So, it contains more downside volatility than upside When share has dropped more than 10% since it's last Earning release, it tends to over react to minor good news and recover some drops if not all. So, it contains more upside volatility than downside.

EPS Surprise (%)

Occurs when a company's reported quarterly or annual profits are above or below analysts' expectations. Here is the formula to derive % EPS Surprice:

Actual EPS - Estimated EPS
------------------------------------- x 100
Estimated EPS

Why is it Important?

Earnings surprises can have a huge impact on a company's stock price. Several studies suggest that positive earnings surprises not only lead to an immediate hike in a stock's price, but also to a gradual increase over time. Hence, it's not surprising that some companies are known for routinely beating earning projections. A negative earnings surprise will usually result in a decline in share price.

Next Day Price Change (%)

Next Regular trading session Closing price following Earnings result.

For After Market Close Earnings, It is a next trading day closing price. For Before Market Open Earnings, It is the same trading day closing price.

Why is it Important?

Next Day price change is a reaction of Earnings result.

Forget Big Oil: The Iran Crisis Shines a Spotlight on Petrobras Stock

Posted on Jul 14, 2026 by Joshua Enomoto

Forget Big Oil: The Iran Crisis Shines a Spotlight on Petrobras Stock

Don’t get me wrong. With the Iranian navy attacking a container ship in the Strait of Hormuz and later announcing that it would close the critical waterway, the spotlight has once again shined brightly on big oil giants like Exxon Mobil (NYSE: XOM) and Chevron (NYSE: CVX). There’s nothing wrong with targeting these securities, especially for longer-term strategies. But for those who are seeking a quick scalp, more love should be directed toward Petrobras (NYSE: PBR).

A Brazilian majority state-owned multinational corporation, Petrobras has suffered a downward slide between the end of April and the beginning of July. However, with the renewed hostilities in Iran, circumstances have cynically moved positively for PBR stock. Over the past five sessions, for example, the security has gained more than 7% of value.

To be fair, the afterhours session on Friday has demonstrated a sideways consolidation. However, with the latest geopolitical spark that was reported on Saturday evening by the New York Times, it’s quite likely that PBR stock and the broader fossil-fuel energy market will rise.

Of course, that’s an obvious inference as a renewed conflict would again impose an inflationary crisis on the global economy, not to mention the catastrophic energy supply chain disruption. Because there’s so much at stake, there’s a non-zero probability that the Trump administration will back down. From just a political angle, the war is deeply unpopular. Plus, it wouldn’t be the first time the White House walked back its previously tough stance.

With that in mind, I’m looking for a near-expiry debit-based options trade. By this, I believe that an argument could be made for a directional trade. Under this framework, I want to pay a debit (start from a cash outflow position) to bet on a particular outcome materializing. Essentially, a debit spread on PBR stock is a low-probability, high-reward wager.

However, it’s more than possible that the way the “low probability” is measured by the market is flawed, opening a door to astute retail traders.

How the World Cup Provides a Lesson on Petrobras Stock


For sports fans everywhere, this year is particularly magical because of the World Cup. Even casual observers have tuned into the soccer tournament as they cheer on the globe’s best players. But what’s fascinating about the beautiful game is how the structure changes as soon as one team scores.

Typically, following the initial kickoff, both teams are cagey — feeling each other out while making sure not to make an early mistake. But as the game drags on and a team eventually makes a breakthrough, the nature of the competition changes. Suddenly, the team with the lead has an incentive to be more defensive-minded, while the team that was scored on must chase the game.

At half-time, each manager could make strategic and personnel changes — all in response to one goal. Now, the question for PBR stock or any other publicly traded security is this: if a soccer team changes how it operates based on shifting conditions in the game, why would the equities market be any different?

Here’s a clear, quantitative example. In the last 10 weeks, PBR stock printed only three up weeks, leading to a downward slope. Before I get into the forward 10-week distribution conditioned for this 3-7-D sequence, ask yourself this: would Petrobras stock respond differently if it had printed only three down weeks, thereby leading to an upward slope?
petrobras-StockEarnings

My theory is yes, the market would almost certainly act differently. Why? Because nowadays, the dominant forces in the equities sector use algorithmic or rules-based trading. When the algos of advanced hedge funds notice that PBR stock flashes a 3-7-D sequence, it may interpret that as a temporary discounted opportunity. Even better, the data puts inductive weight on the theory.

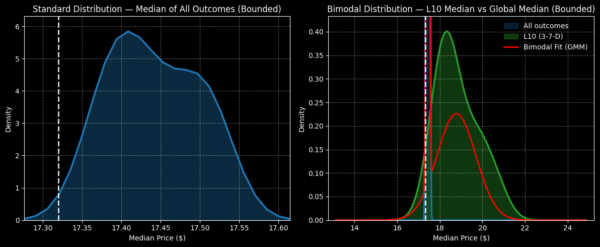
Conditioned for the 3-7-D sequence (which has flashed 24 times on a rolling basis since January 2019), the expected 10-week forward distribution of PBR stock would likely stand between $16 and $22, with probability density peaking around $18.20. That’s assuming a starting price of $17.32, Friday’s close.

Why is this observation significant? Because as a random baseline, the expected forward distribution of PBR stock would be between $17.25 and $17.60, with probability density peaking near $17.41. On average across the spectrum, you’re looking at a 4.54% positive variance.

Playing the Inductive Card Shrewdly for Petrobras Stock

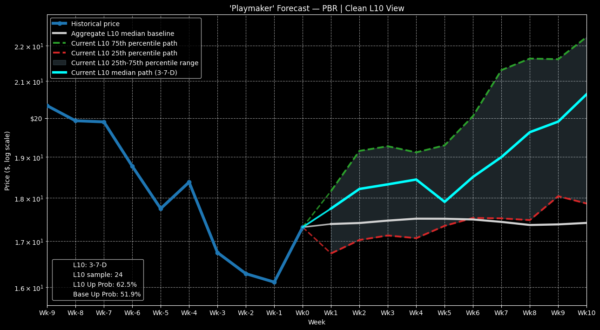
Although the forward distribution of Petrobras stock under 3-7-D conditions statistically has a better expected performance outcome than the random baseline, the trajectory may not be linear. From an inductive viewpoint, PBR has a tendency of rising through the first four weeks before taking a conspicuous dip on week 5.

Obviously, there’s no guarantee of the uniformity of nature, meaning that anything could happen this time around. However, if we were to play the numbers, the 17.50/18 bull call spread expiring July 31 could be interesting. Over the next three weeks, PBR stock would be expected to rise through the $18 level, which should trigger the second-leg strike. Doing so at expiration would result in a 150% maximum payout.
petrobras-StockEarnings

What’s really eye-catching here is the net debit, which is only $20 per spread. It’s a tantalizing opportunity but the reason is that the market only assigns a probability of 38% that PBR stock will rise to $17.70, the breakeven point for the above spread.

While 38% sounds dangerously low, this figure is calculated largely by the distance (in standard deviations) the spot price is from the target threshold, assuming a risk-neutral, log-normal distribution. However, as I just explained with the World Cup example, a distribution of outcomes is likely to change based on shifting conditions.

In this case, we shouldn’t calculate the probability of PBR stock assuming risk neutrality. Instead, we must calculate it based on its current sentiment state, which is negative. Observationally, because of the extended negativity, there’s a greater chance of positive mean reversion.

Fundamentally, I dispute the market’s low probability of profit (reaching breakeven). Indeed, the odds that Petrobras stock rises above $17.32 by the end of week 3 is 70.8% (or 17 occurrences over 24 times). I wouldn’t be surprised, then, if the chance of PBR hitting $17.70 is between 58% to 60%, not 38%.


Joshua Enomoto is a seasoned financial writer with a strong track record of in-depth stock analysis, offering clear, insightful commentary for retail investors across all levels of expertise. Renowned for his ability to blend analytical rigor with engaging wit, Joshua's work has been featured on leading investment platforms, including TipRanks, InvestorPlace, Barchart, Benzinga, and Fintel. He was also handpicked to spearhead high-impact initiatives such as InvestorPlace's "Trade of the Day" and Benzinga’s ETF coverage. As a frequent guest expert for CGTN America, Joshua discusses a wide range of economic, societal, and consumer market trends. A graduate of U.C. San Diego, Joshua brings a thoughtful and fresh perspective to complex financial narratives, helping enterprise clients connect with their audiences. He also composes music in his spare time.

Join over 1.2M+ investors/traders who receive daily and weekly notable earnings alerts with predicted move