ajax loader

Loading...


Ride-the-Wave Strategy – Best for Stock Traders

Ride-the-Wave targets multi-day price momentum following a company’s earnings announcement (EA). With this strategy:

  1. Buy a stock one day post-EA if a stock reacts positively post-earnings:
    1. Near the close of trading the EA-day for a pre-market-EA
    2. Near the close of the following day for a post-market-EA
  2. Sell-to-close after 7-10 days, or possibly earlier if a desired price target is reached

Similarly,

  1. short a stock one day post-EA if a stock reacts negatively post-earnings:
    1. near the close of trading the EA-day for a premarket-EA
    2. near the close of the following day for a post-market-EA
  2. then buy-to-close after 7-10 days, or possibly earlier if a desired price target is reached

Important: Ride-the-Wave is predicated on significant price momentum triggered by an EA. The 7-10 day scenario is the maximum trade hold-time. If you see post EA-momentum is halted or reversed by a significant opposite move, re-evaluate your presence in the trade.

This popular StockEarnings screen below will give you a list of stocks that historically exhibit significant price momentum following an EA for the next seven days:

  1. Stocks exhibiting positive post-EA price moves are buy-candidates
  2. Stocks exhibiting negative post-EA price moves are sell/short-candidates

The screen includes those stocks whose Earnings just came out in last two days.

Screen criteria:

  1. Earnings Date Start Date : Current Date + -1 Day
  2. Earnings Date End Date : Current Date + -2 Days
  3. Predicted Move (Next Day) Max : 7%
  4. Predicted Move (On 7th Day) Min : 7%

Strategy Guideline:

  1. Buy the stock if stock has reacted positively. Short the stock if stock has reacted negatively (see above).
  2. Close the position in 7-10 days, or possibly earlier based on price move.

Volatility Crush Strategy - Best for Options Traders

The Volatility Crush strategy is used with stocks that typically experience relatively low-to-moderate price moves (≤4%) following their Earnings Announcements (EA). The basic trade idea is to sell put or call options right before the EA, collecting a credit when options premium is very high due to elevated implied volatility (IV). You then close the position right after the EA by buying the option back much cheaper due to the significant drop in IV that occurs after the mystery of the EA disappears. In assessing this trade, you need to do your homework to ensure you collect sufficient premium to make the trade worthwhile.

This trade is practical due to the low-to-moderate price-move after the EA, which generally won’t significantly affect the options price, unlike an “action” stock, which experience great price moves post-EA. With these symbols, if you’re on the right side of the price move, that’s a great thing. But if you’re on the wrong side of the move, not so great. Consequently, by minimizing the effect of the post-EA price move, you have a much better chance to profit from the reduction in IV without it being ruined by a violent price move.

For this trade, open the position either (1) the night before the EA when the company announces earnings or (2) during the EA day when it announces post-market, generally capturing IV at or close to its peak.

For this trade, open the position either (1) the night before the EA when the company announces earnings or (2) during the EA day when it announces post-market, generally capturing IV at or close to its peak.

This popular stockearnings screen will give you a list of stocks which do not react more than 4% fpost-EA. It includes only those stocks whose earnings are releasing next day.

Screen criteria:

  1. Earnings Date Start Date : Current Date + 1
  2. Earnings Date End Date : Current Date + 1
  3. Predicted Move (Next Day) Max : 4%
  4. Options Type: Weekly

Strategy Guideline:

  1. Options Strategy: Sell Call and Put
  2. Options Strike Price: Current Stock Price – (% Predicated Move x 2)
  3. Expiration Date: It should generally be the closest expiry immediately after the EA.
  4. Buy Insurance: Buying back Call and Put at Strike price which 10% lower than Sell Strike Price is optional but recommended.

Watch Video for More Detail

Volatility Rush Strategy - Best for Options Traders

The Volatility Rush takes advantage of increasing options premiums into earnings announcements (EA) caused by an anticipated rise in Implied Volatility (IV). With this strategy, Buy a Call and Put at-the-money (a long straddle) 2-3 weeks before the EA when IV is lower. Sell the position either (1) the night before the EA when the company announces earnings pre-market, or (2) during the EA day when it announces post-market, generally capturing IV at or close to its peak.

This popular screen will give you a list of stocks whose Options premiums tend to rise into Earnings. It includes only those stocks whose Earnings are at least two weeks away from today.

Screen criteria:

  1. Earnings Date Start Date : Current Date + 15 Days
  2. Earnings Date End Date : Current Date + 30 Days
  3. Predicted Move (Next Day) Min : 5%
  4. Options Type: Weekly or Monthly if that lines up with the two to three-week lead-time for entering the trade

Strategy Guideline:

  1. Buy a Straddle at or close to the money two to three weeks pre-EA.
  2. Sell the position either the night before the EA when the company announces earnings pre-market, or during the EA day when it announces post-market.
  3. Expiration date should generally be the closest expiry immediately after the EA.
  4. Straddle price should not be more 60% of predicted move.

Predicted Move (Volatility)

Similar to Implied Volatility in Options. Expected volatility % based on our Proprietary Volatility Predication Model. We are expecting that stock price will likely to reach % in either direction by the end of next trading session after Earnings are released and not necessarily the closing volatility %.

Why is it important?

    This indicator helps

  1. Knowing expected volatility in stocks after Earnings helps to decide trading stocks before Earnings Announcement.
  2. Taking Advantage of volatility collapse following Earnings Results by using Advance Options strategies such as Spread and Straddles.

Since Last Earnings

Change in share price since last Earnings release.

Why is it Important?

When share has gained more than 10% since it's last Earning release, it tends to over react to minor bad news and give up some gains if not all. So, it contains more downside volatility than upside When share has dropped more than 10% since it's last Earning release, it tends to over react to minor good news and recover some drops if not all. So, it contains more upside volatility than downside.

EPS Surprise (%)

Occurs when a company's reported quarterly or annual profits are above or below analysts' expectations. Here is the formula to derive % EPS Surprice:

Actual EPS - Estimated EPS
------------------------------------- x 100
Estimated EPS

Why is it Important?

Earnings surprises can have a huge impact on a company's stock price. Several studies suggest that positive earnings surprises not only lead to an immediate hike in a stock's price, but also to a gradual increase over time. Hence, it's not surprising that some companies are known for routinely beating earning projections. A negative earnings surprise will usually result in a decline in share price.

Next Day Price Change (%)

Next Regular trading session Closing price following Earnings result.

For After Market Close Earnings, It is a next trading day closing price. For Before Market Open Earnings, It is the same trading day closing price.

Why is it Important?

Next Day price change is a reaction of Earnings result.

Value Trap or Cheap Stock? How to Know Which is Which

Posted on Jul 13, 2026 by Grayson Cavern

Value Trap or Cheap Stock? How to Know Which is Which

One of the most dangerous words in investing isn’t bubble. It’s cheap. The moment a great company loses half its value, investors start circling with the same thought that it can’t possibly get any cheaper. That is how many investors fall into value traps.

History encourages that instinct – buying Amazon (NASDAQ: AMZN) after a brutal selloff made fortunes, Apple (NASDAQ: AAPL) looked broken more than once before becoming the most valuable company on earth, and Microsoft (NASDAQ: MSFT) spent years going nowhere before Satya Nadella rewrote the entire trajectory of the business.

But markets have another habit investors forget when a stock they’ve watched for years suddenly goes on sale. Some companies never come back. So when does a cheap stock stop being a bargain and start becoming a value trap? Most investors answer with a price chart. I start with the business.

When a Cheap Stock Becomes a Value Trap


The biggest mistake investors make when a stock falls hard is assuming a lower valuation automatically creates a better investment. Intel (NASDAQ: INTC) is the cleanest example of why that assumption keeps destroying capital in portfolios that should know better.

For years, investors pointed to Intel’s forward earnings multiple as proof the market was irrationally ignoring a bargain. At various points it traded near 10-12x forward earnings. A steep discount to most of the semiconductor industry and screeners kept flagging it as one of the cheapest names in tech.

That’s where they fell into a value trap. Let me explain why the problem was never the multiple but the moat.

While investors anchored to Intel’s P/E ratio, the company was losing manufacturing leadership, falling behind in AI accelerators, and watching customers like Apple exit to design their own silicon. NVIDIA, meanwhile, was building an ecosystem around CUDA that locked developers and hyperscalers into a platform competitors couldn’t displace simply by offering similar hardware at a lower price.

Intel became cheaper because its competitive advantage contracted. NVIDIA stayed expensive because its competitive advantage expanded. Those are two completely different businesses wearing similar sector labels, and the P/E ratio was the last thing you should have been looking at to tell them apart.

Management Either Builds Tomorrow Or Defends Yesterday

Sometimes the business itself isn’t the problem, the people running it are.

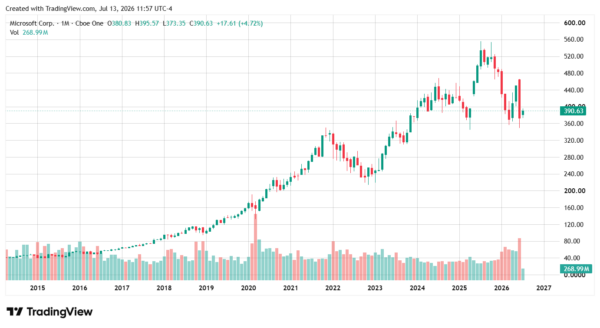
A decade ago, Microsoft looked exactly like a mature technology company whose best years were behind it. Windows defined its entire identity, revenue growth had stalled, and the market had largely written off its chances of finding the next platform shift.
value trap-StockEarnings

It looked like a value trap, and probably was. But then Satya Nadella took over in 2014 and made the decision that separated Microsoft from every other legacy technology company facing the same disruption: instead of protecting the businesses that had made the company wealthy, he rebuilt its entire future around cloud computing, subscriptions, and AI.

Annual revenue has since grown from roughly $93 billion to well over $280 billion. And investors smiled at the bank thanks to the management changing what the business was becoming before the market forced its hand.

Intel faced the same technological disruption during roughly the same period. Only one reinvented itself in time, and the stock charts of both companies since 2014 tell you everything. Whenever I study a beaten-down stock, I keep asking if management is building tomorrow’s company, or defending yesterday’s? That answer matters more than anything on the income statement.

Some Industries Change Faster Than Any Company Can Follow

This is where most value traps are born because the company can still look operationally sound while the ground underneath it shifts permanently.

Take PayPal (NASDAQ: PYPL) for example. During the pandemic, investors valued it as if it owned the future of digital payments. Today it trades at mid-teens on forward earnings, a fraction of its former multiple, and the easy conclusion is that the stock has become cheap.

My question is whether it deserves the valuation it earned when digital wallets were still an emerging category PayPal effectively defined. Today, Apple Pay, Google Pay, Block, Stripe, and modernized bank apps have collectively fragmented a market PayPal once owned by default. Digital payments are still growing. PayPal simply no longer controls the category it helped create, and a falling multiple on a business losing structural positioning isn’t value. It’s the market updating its opinion in real time.

The Market Is Never Wrong About The Multiple For Long

Professional investors spend surprisingly little time asking whether a stock is cheap and more time asking why, because valuation multiples aren’t random noise. They’re the market’s collective opinion about what a company’s future looks like relative to its present, and that opinion updates as the evidence does.

Sometimes the market becomes too pessimistic about a business that is genuinely healing, and multiple expansion follows as confidence returns. But the opposite also happens more often than most retail investors account for. A company keeps generating profits while the market steadily lowers the multiple it’s willing to pay, because the consensus has shifted on whether tomorrow will resemble yesterday at all. That’s multiple compression, and it can erase years of earnings growth while the income statement continues to look acceptable on the surface.

Keep this in mind, every cheap stock deserves three questions before it earns a place in your portfolio: 

Has its competitive advantage weakened or expanded? 

Has management adapted to the disruption it faces, or is it defending a position that no longer exists? 

And has the industry changed faster than the company can follow? 

Personally, how far a stock has fallen from its peak doesn’t really matter. I’m more focused on whether the business that once justified yesterday’s valuation still exists in a recognizable form today. Every great investment eventually becomes cheap at some point. Some cheap stocks eventually become great investments too. The distance between those two sentences is where most of the money gets lost.


Join over 1.2M+ investors/traders who receive daily and weekly notable earnings alerts with predicted move